Figure 5.
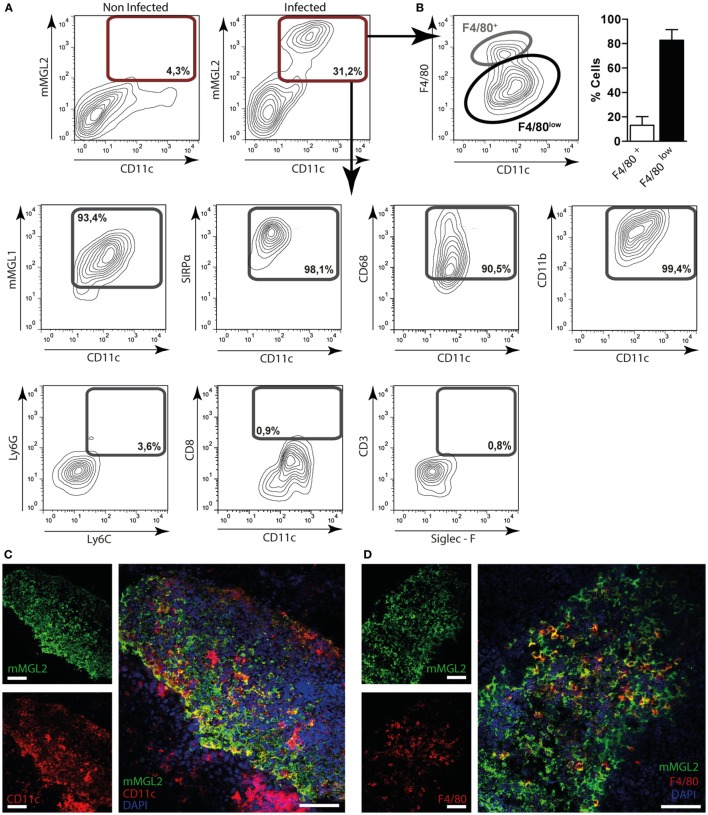
Immunephenotyping of mMGL2+ cells in the peritoneum and in the liver of F. hepatica-infected animals. (A) Cells from the peritoneal cavity from infected or control mice were stained with CD11c-, mMGL1-, mMGL2-, CD11b-, CD8-, F4/80-, SIRPα-, CD68-, Ly6G-, Ly6C-, CD3-, and Siglec-F-specific antibodies and evaluated by flow cytometry. (B) Percentage of mMGL2+ CD11c+ F4/80+ or mMGL2+ CD11c+ F4/80low cells from PECs of infected animals. (C) Expression of MGL2+ and CD11c+ cells in the liver of infected mice. (D) Expression of MGL2+, CD11c+ and F4/80+ cells in the liver of infected mice. The bar represents 100 μm. A representative figure of three independent experiments is shown (±SD, indicated by error bars).

