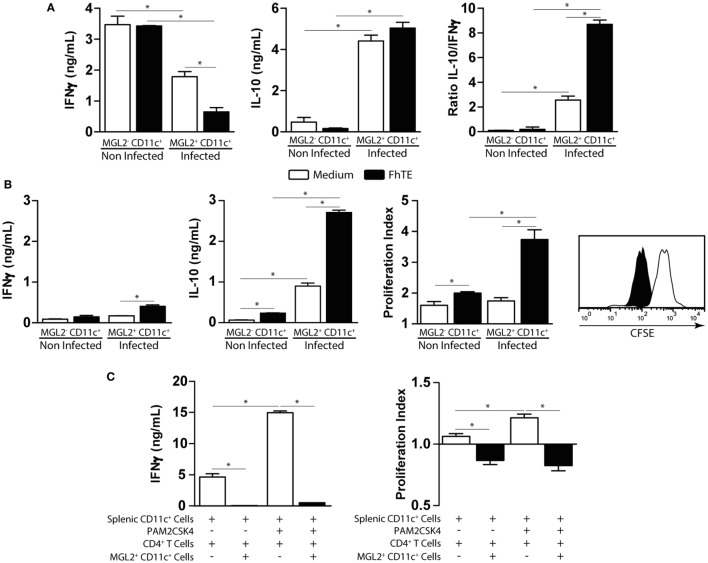
Figure 7.
Functional analyses of CD11c+ mMGL2+ cells. (A) CD11c+ purified cells from the peritoneal cavity of infected or control mice were stimulated with FhTE-coated plates overnight at 37°C, washed and incubated with purified C57BL/6 CD4+ T cells from naive animals for 5 days at 37°C. IFNγ and IL-10 production by T cells was evaluated on culture supernatants by ELISA. (B) CD11c+ purified cells from the peritoneal cavity of infected or control mice were stimulated with FhTE overnight at 37°C, washed and incubated with purified BALB/c CD4+ T cells from 3-week-infected animals for 5 days at 37°C. IFNγ and IL-10 production by T cells was evaluated on culture supernatants by ELISA. Proliferation was evaluated on CFSE-stained CD4+ T cells by flow cytometry. The proliferation index was calculated as the ratio between the percentage of CFSElow CD4+ cells and CFSElow CD4+ cells with medium. (C) CD11c+ purified cells from the spleen of naïve BALB/c mice were stimulated with Pam2CSK4 in the presence or absence of FhTE overnight at 37°C, washed and incubated with purified C57BL/6 CD4+ T cells from naive animals for 5 days at 37°C in presence or absence of MGL2+ CD11c+ cells (100,000/well) from 3-week-infected animals. IFNγ production by T cells was evaluated on culture supernatants by ELISA. Proliferation was evaluated on CFSE-stained CD4+ T cells by flow cytometry. The proliferation index was calculated as the ratio between the percentage of CFSElow CD4+ cells and CFSElow CD4+ cells with medium. A representative figure of three independent experiments is shown (±SD, indicated by error bars). Asterisks indicate statistically significant differences (*p < 0.05).

