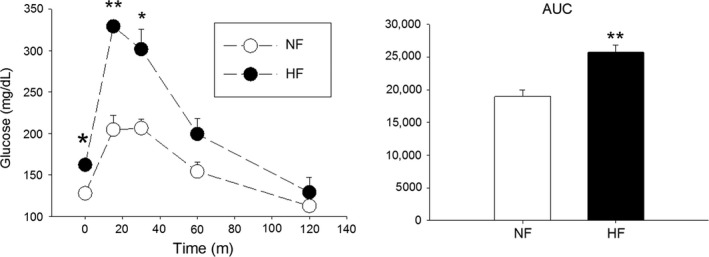
Figure 6.

Glucose tolerance test in nonpregnant, multiparous dams fed HF diet (n = 3) reveals impaired glucose tolerance compared to NF (n = 4) dams. Glucose concentrations were taken after a 6 h fast, and 15, 30, 60 and 120 min following an IP injection of glucose. The AUC of the two groups was also calculated.*P < 0.05, and **P < 0.01. HF, high‐fat; NF, normal‐fat; AUC, area under the curve.
