
Figure 5.
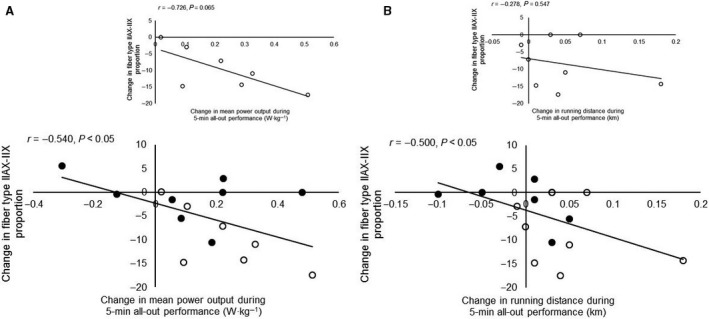
A: Correlation between changes in type IIAX‐IIX proportions and changes in mean power output during the 5‐min all‐out cycling test. The inserted panel shows the correlation when only the athletes adding strength training to their normal endurance training are included. B: Correlation between changes in type IIAX‐IIX proportions and changes in running distance during the 5‐min all‐out running test. The inserted panel shows the correlation when only the athletes adding strength training to their normal endurance training are included.