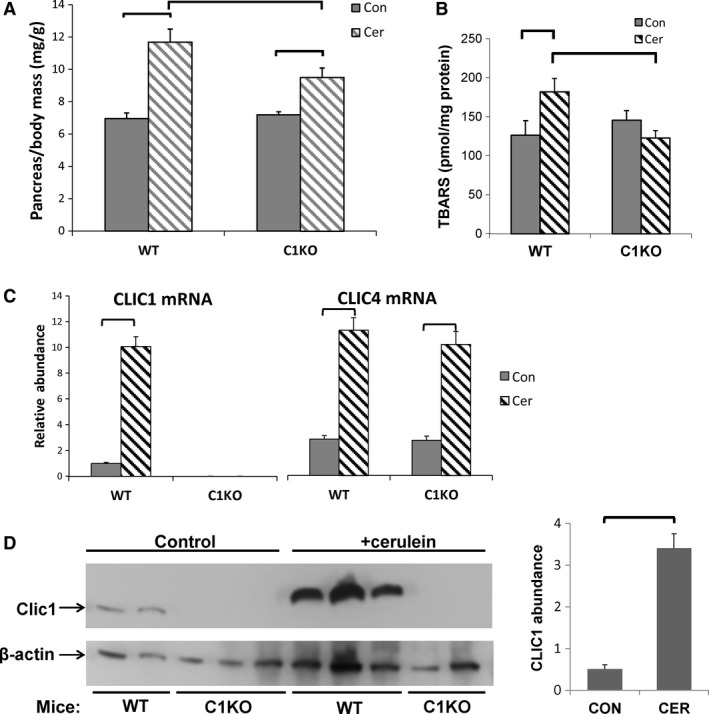
Figure 2.

Acute pancreatitis (see also Table 2). (A) Pancreas to body mass ratio (mg/gm, n = 10 for each group), (B) tissue TBARS (pmole/mg protein, n = 9 for controls, n = 10 for cerulein‐treated groups), and (C) relative mRNA levels (normalized to GAPDH) in control (solid bars) and cerulein‐treated (hatched bars) WT or C1KO mice as marked. For all control groups, n = 9; for all cerulean‐treated groups, n = 10. (D) Left: Western blot of total pancreatic protein probed for CLIC1 (AP1089 antibody, upper panel) or β‐actin (lower panel) from control or cerulein‐treated WT or C1KO mice as marked. Right: Average pancreatic CLIC1 abundance, normalized to β‐actin from control or cerulean‐treated WT mice (con n = 2; cer n = 3). Data presented are means +/‐ SEM. Brackets indicate pairwise comparisons for which P < 0.05.
