Figure 13.

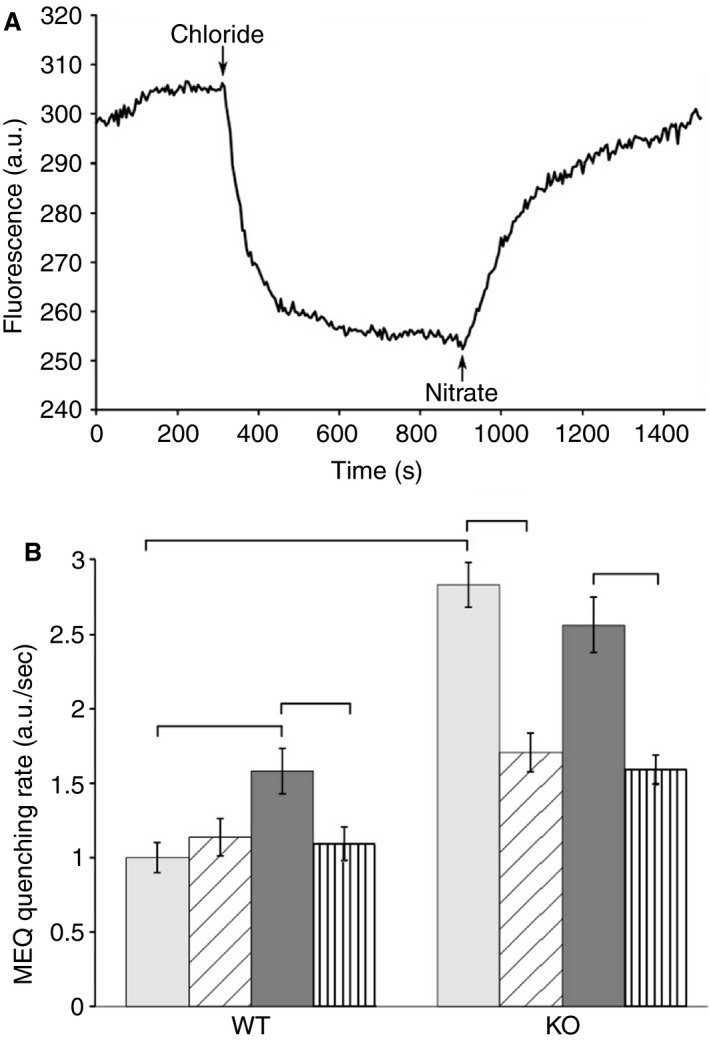
Macrophage Anion Permeability. (A) Example of fluorescence intensity recording from single MEQ‐loaded cell. Recording starts in the presence of nitrate‐containing bath solution, which is changed to chloride containing bath and then back to the nitrate at the arrows as indicated. The fractional rate of drop in fluorescence in the first 25 sec after introduction of chloride is taken as the anion permeability of the cell. (B) Average rates of fractional fluorescence quenching derived from the first 25 sec after introduction of chloride into the bath. Pale bars: unstimulated cells; diagonally hatched bars: unstimulated cells in the presence of IAA‐94; dark filled bars: PMA‐stimulated cells; vertically hatched bars: PMA stimulated cells in the presence of IAA‐94. Data are means; error bars represent SEM. See text for values, standard errors, and sample size of each group. Brackets indicate pairwise comparisons for which P < 0.05.
