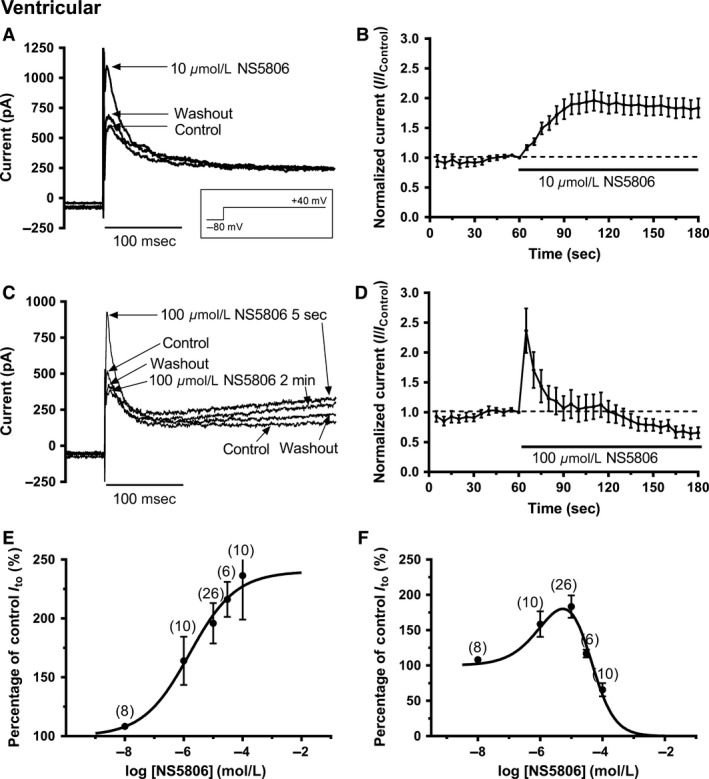
Figure 1.

NS5806 modulation of I to from rabbit ventricular cells. (A) Representative current records in control, after application of 10 μmol/L NS5806 and after washout with control solution. The voltage protocol is shown as an inset. (B) Mean (± SEM, n = 26) time course of response to 10 μmol/L NS5806 of Ito (measured as peak minus end‐pulse current), using protocol shown in A. (C) Representative current records in control, after application of 100 μmol/L NS5806 and after washout with control solution. The voltage protocol is the same as that used for panel A. (D) Mean (± SEM, n = 10) time course of response of Ito (peak minus end‐pulse current) to 100 μmol/L NS5806, using protocol shown in A. Note the initial stimulation followed by inhibition. (E) Concentration‐dependence of the maximal agonist effect of NS5806 on Ito. Data (for peak minus end‐pulse current effects) were fitted with a standard Hill‐equation to get the EC 50 and nH values given in the ‘Results’ text. Values in parentheses denote number of independent replicates at each concentration. (F) Concentration–response relation for the steady‐state effect of NS5806 on Ito. For each cell, the effect of NS5806 at 120 sec was recorded and current amplitude expressed as a % of control. Data (for peak minus end‐pulse current effects) were fitted with a two site (agonist and antagonist) Hill‐equation to get the EC 50/IC 50 and nH values. Values in parentheses denote number of independent replicates at each concentration.
