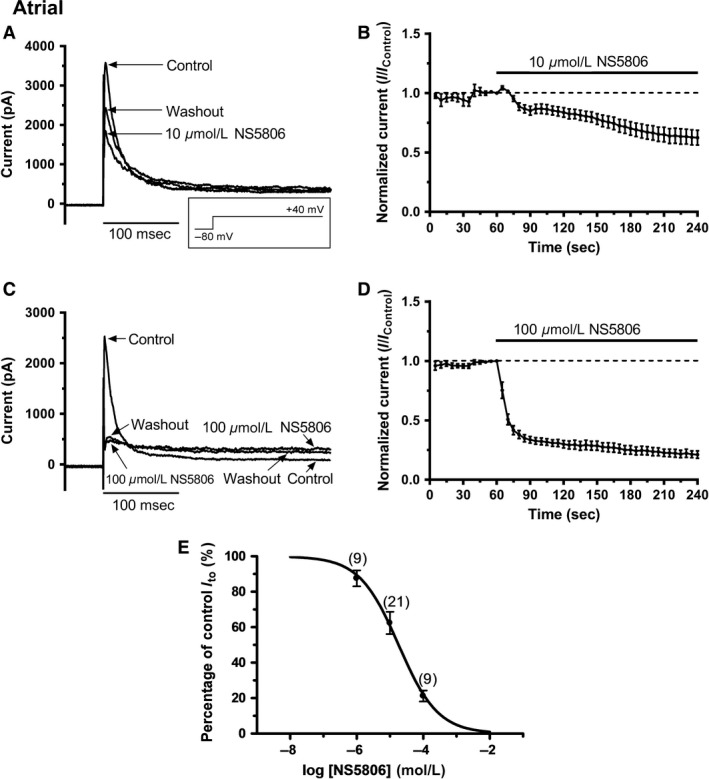
Figure 2.

NS5806 inhibition of I to from rabbit atrial cells. A: Representative current records in control, 10 μmol/L NS5806 and washout with control solution elicited by the protocol shown as an inset (same protocol as Figure 1). B: Mean (± SEM, n = 21) time course of response to 10 μmol/L NS5806 of Ito (measured as peak minus end‐pulse current, using protocol shown in A. C: Representative current records in control, after application of 100 μmol/L NS5806 and after washout with control solution. The voltage protocol is the same as that used for panel A. D: Mean (± SEM, n = 9) time course of response of Ito (peak minus end‐pulse current) to 100 μmol/L NS5806, using protocol shown in A. E: Isochronal concentration–response relation for the inhibition of atrial Ito by NS5806. For each cell, the effect of NS5806 at 180 s (on peak minus end‐pulse currents) was recorded and current amplitude expressed as a % of control. Data were fitted with a Hill‐equation to get the IC 50 and nH values given in the ‘Results’ text.
