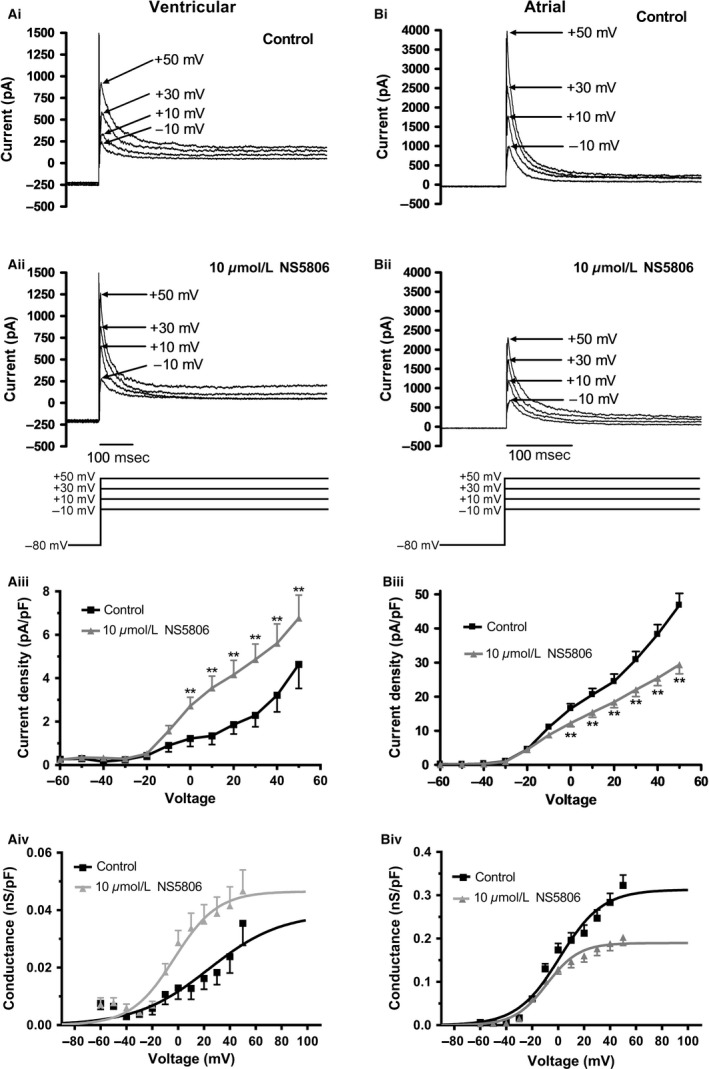
Figure 3.

Effects of NS5806 on voltage dependence of I to activation. Ai‐Aii: Representative ventricular current traces with control solution (Ai) and 10 μmol/L NS5806 (Aii) at the potentials indicated (protocol shown as lower panel of Aii). From the holding potential of ‐80 mV, an initial 1‐second duration ‘conditioning’ step was applied to potentials between −90 and +50 mV in 10 mV increments. The conditioning step both enabled activation of Ito (on depolarization) and also enabled subsequent inactivation during the maintained depolarization. A second 500 msec ‘test’ step to +40 mV was applied to determine how availability (inactivation) of Ito was influenced by the conditioning pulse. A brief (3‐msec) step at −80 mV was included between the first and second steps to ensure that any residual capacitance artefacts that occurred during the test depolarization were not influenced by differing conditioning voltages. Interpulse interval was 5 sec. Aiii: Mean I‐V relations (normalized to cell capacitance) for ventricular Ito elicited by the initial 1s step of protocol described above, in control and in 10 μmol/L NS5806 (same protocol as Ai,Aii; n = 7). Control data are shown in black; NS5806 data are shown in gray (error bars indicate SEM). ** denotes significant difference at P < 0.01. Aiv: Voltage‐dependence of conductance for ventricular Ito (same experiments as shown in Aiii). Data were fitted with a Boltzmann equation of the form: G/Gmax=1/[1 + exp[(V0.5‐V)/ka]], where G=conductance at test voltage V, Gmax= maximal conductance, V0.5=half‐maximal activation voltage, and ka=activation slope factor. V0.5 and ka values are given in the ‘Results’ text. Bi‐Bii: Representative atrial current traces with control solution (Bi) and 10 μmol/L NS5806 (Bii) at the potentials indicated. The protocol was the same as for ventricular cells as shown in Ai. Biii: Mean I‐V relations (normalized to cell capacitance) for atrial Ito in control and in the presence of 10 μmol/L NS5806 (same protocol as Bi,Bii; n = 8). Control data are shown in black (and with +SEM bars); NS5806 data are shown in gray (and with ‐SEM bars). ** denotes significant difference between control and NS5806 at P < 0.01. Biv: Voltage‐dependent activation curves for atrial Ito (data from same experiments as Biii). For each experiment and each recording condition (control and NS5806) macroscopic conductance values were calculated at each voltage, normalized to maximal conductance during the protocol and pooled data fitted with the Boltzmann equation as described above.
