Figure 4.

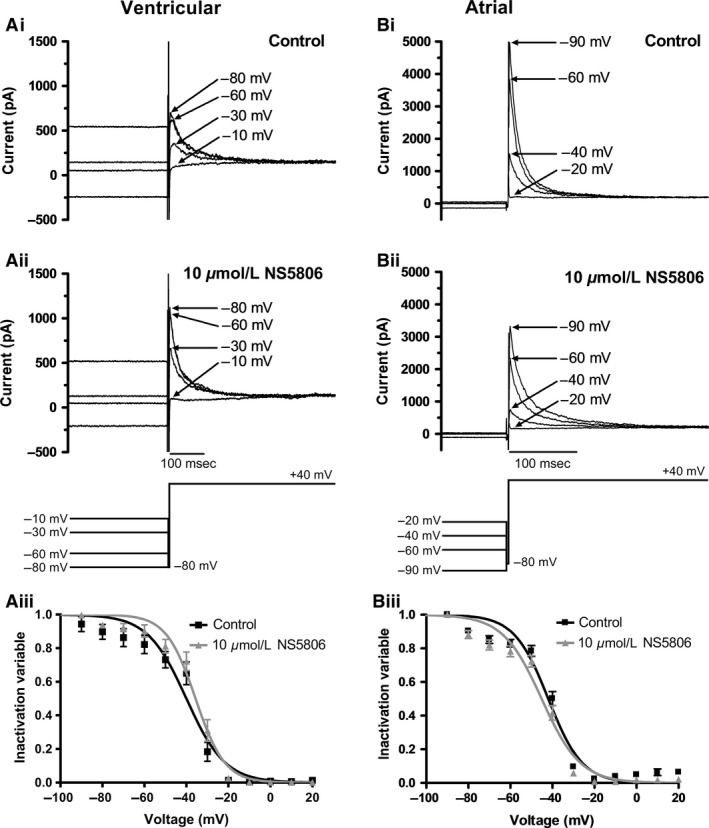
Effect of NS5806 on voltage‐dependent inactivation of I to. Ai–Aii: Representative ventricular current traces with control solution (Ai) and 10 μmol/L NS5806 (Aii) elicited by protocol shown as lower panel of Aii. Full protocol contained 1 sec conditioning steps in 10 mV increments between −90 mV and +20 mV, followed by a 500 msec test pulse to +40 mV. Conditioning and test steps were separated by a brief (3 msec) period at −80 mV. The figure focuses on currents elicited by the test step following conditioning steps to the voltages indicated. Currents at selected voltages are shown for clarity of display. Aiii: Mean (± SEM) plots of inactivation variables against conditioning voltage in control and in the presence of 10 μmol/L NS5806 (n = 7). For each experiment and each condition, currents during each test command were normalized to the maximal test current observed during the protocol, pooled and plotted against conditioning voltage. Data were fitted by a Boltzmann function: I/Imax=1‐[1/[1 + exp((V0.5‐V)/ki)]], where I=current during the test pulse (+40 mV), V= conditioning voltage, Imax= maximal test current, V0.5=half‐maximal inactivation voltage, and ki=inactivation slope factor. V0.5 and ki values are given in the Results text. Bi–Bii: Representative atrial current traces with control solution (Bi) and 10 μmol/L NS5806 (Bii) elicited by protocol shown as lower panel of Bii. Voltage protocol as described for ‘A’. The figure shows currents elicited by the test step after selected conditioning steps (voltages indicated on traces). Biii: Mean (± SEM) plots of atrial inactivation variables against conditioning voltage in control and NS5806 (n = 8). Data were fitted by the Boltzmann equation described in ‘A’. V0.5 and k i values are given in the Results text.
