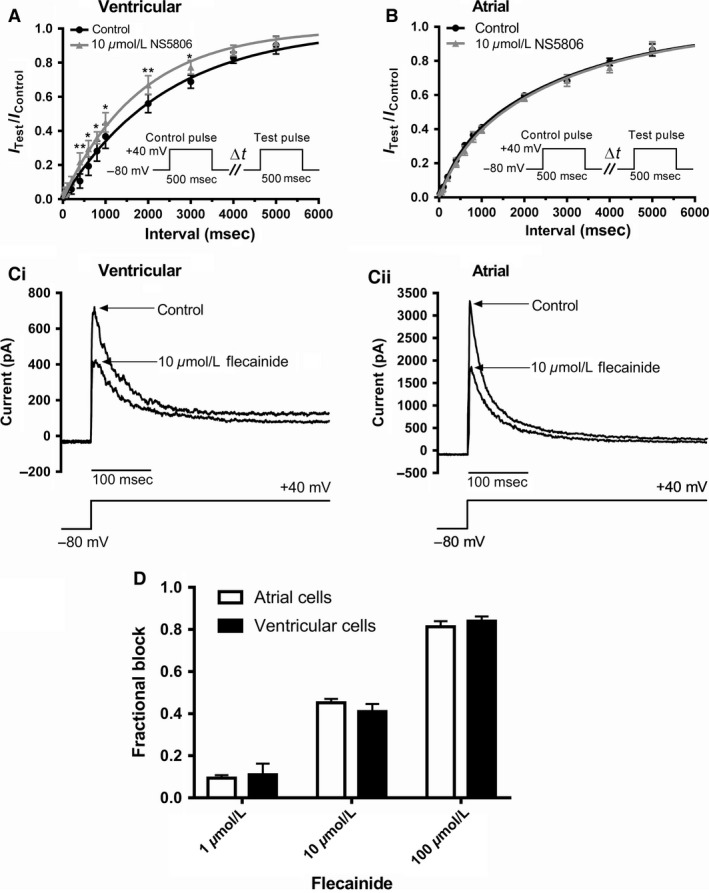
Figure 5.

Effect of NS5806 on recovery of I to from inactivation (“restitution”) in atrial and ventricular myocytes and response to flecainide. The protocol for studying restitution is illustrated in the insets to panels A and B: an initial 500 msec depolarizing step from −80 mV to +40 mV was followed by varying intervals (Δt, 20 msec to 5000 ms) at −80 mV followed by a ‘test’ depolarization to +40 mV. Each pair of pulses was separated by 10 sec. For each pulse‐pair, the magnitude of Ito elicited by the second command (IT est) was expressed as the fraction of that elicited by the first (IC ontrol). A: Mean (± SEM) data (n = 6) for recovery of Ito from inactivation for ventricular myocytes, in control (black) and 10 μmol/L NS5806 (gray). Data were fitted by a single exponential function to get time constant values given in the Results. *difference between Control and NS5806 at P < 0.05; ** P < 0.01. B: Mean (± SEM) data (n = 7) for recovery of Ito from inactivation for atrial myocytes, in control (black) and 10 μmol/L NS5806 (gray). Data were fitted by a bi‐exponential function to get time constant values given in the Results text. C: Representative traces of Ito in control and following exposure to 10 μmol/L flecainide (same protocol as used in Figures 1 and 2) for ventricular (Ci) and atrial (Cii) myocytes. D: Bar chart plots for flecainide inhibition of ventricular and atrial Ito (n = 6–7 cells for each concentration for both cell types). 2‐way ANOVA with Bonferroni's post‐test confirmed that for each cell type the concentration dependence of the inhibitory effect was significant (P < 0.05), whilst at no concentration did the extent of inhibition differ significantly between atrial and ventricular cells.
