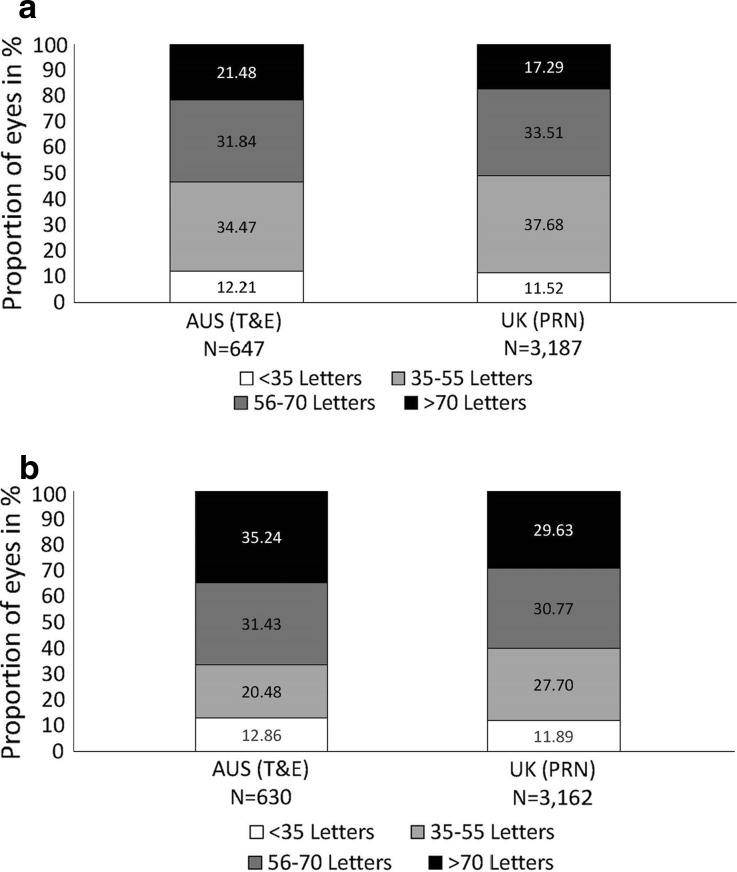
Fig. 2.
Proportion of eyes (in %) per pre-defined VA category. a At baseline; b at 12 months. For each VA category the proportion of eyes was compared between T&E and PRN at 12 months, using a logistic regression model. After adjustment of the odds ratio for baseline VA, the decrease in the proportion of eyes achieving 35–55 letters in Australia (i.e. T&E) was significantly larger when compared to the UK (i.e. PRN) (p < 0.001). For the remainder categories this test did not reach statistical significance. AUS Australia, PRN pro re nata, T&E treat-and-extend, VA visual acuity

