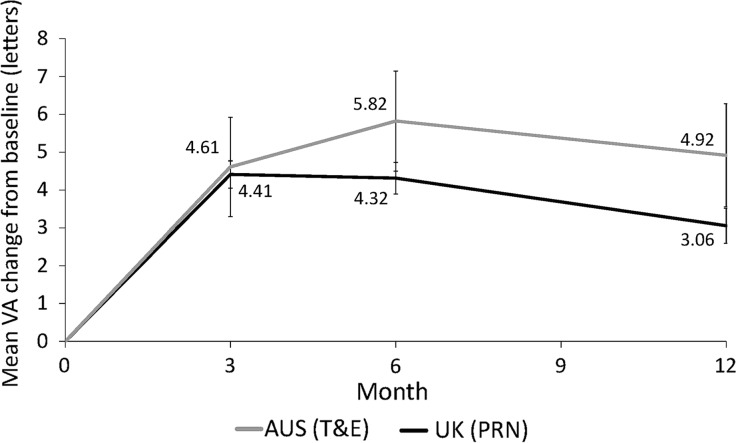
Fig. 3.
Mean VA change from baseline by time and country—12-month follow-up cohort. Non-inferiority of T&E compared to PRN was concluded [T&E vs. PRN: 2.07 ± 0.68 (95% CI 0.73–3.41), GEE model] based on mean change in VA (±SE) from baseline to month 12. A comparison of the study groups based on the analysis of covariance adjusting for patient baseline VA yielded similar results (results not shown). AUS Australia, error bars 95% CI values, PRN pro re nata, T&E treat-and-extend, VA visual acuity

