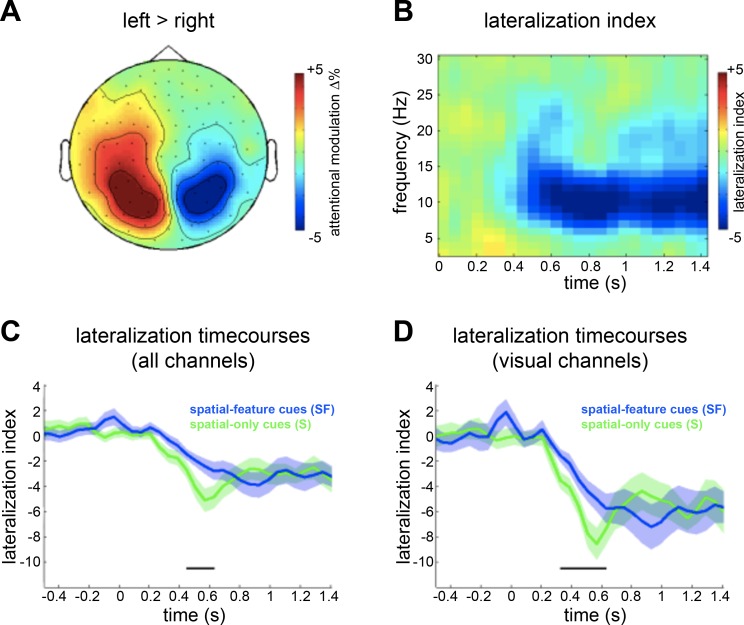
Fig. 2.
A: topographic plots showing normalized difference in α power (8–14 Hz, averaged over significant time window) between left and right spatial cues, expressed as percentage change {i.e., [(left – right)/(left + right)] × 100}. B: average time-frequency representations of α lateralization index {i.e., [(contralateral – ipsilateral)/(contralateral + ipsilateral)] × 100}, calculated across all spatial cueing types (S, SF), collapsed over all channels, and time locked to cue onset. C and D: time courses of α power lateralization index for SF (blue) and S (green) cues, averaged over all channels (C) and over visual channels (D), time locked to cue onset. The black bars denotes where the conditions are significantly different (cluster P < 0.05).

