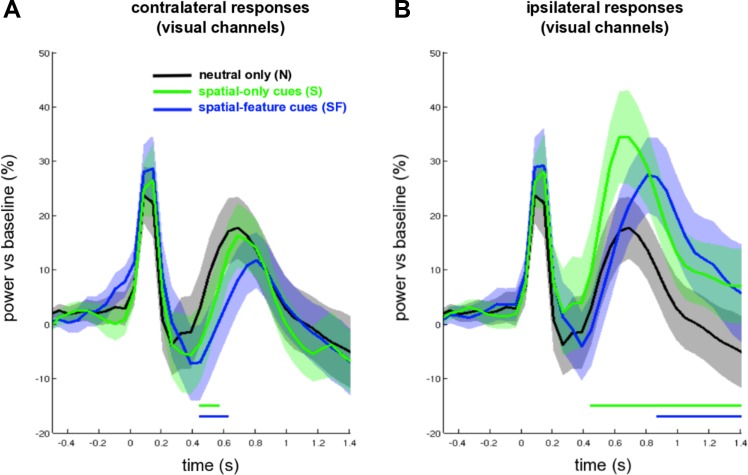
Fig. 3.
Time courses of contralateral (A) and ipsilateral (B) α power responses, averaged over visual channels, for SF (blue line) and S (green line) cues, together with α power responses following N cues (black line), time locked to cue onset. The dotted and solid blue bars denote significant differences between N cueing and S cueing conditions and between N and SF cueing conditions, respectively (P < 0.05).

