FIG 1.
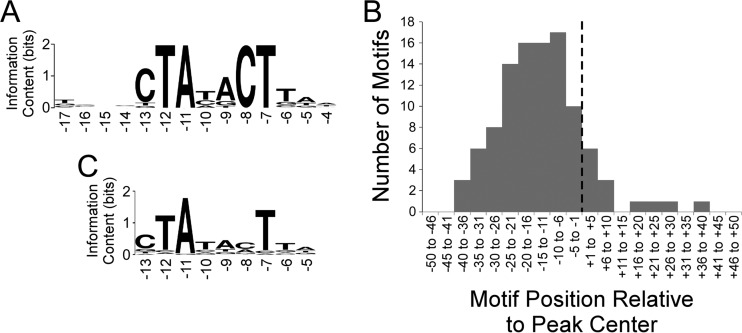
Analysis of RpoS ChIP-seq data. (A) Sequence logo (86) of the enriched sequence motif associated with RpoS-bound regions (MEME E value, 2 × 10−40). The sequence logo was generated using WebLogo (87). Numbers below the motif refer to positions relative to the transcription start, based on known sequence preferences for RpoS (22). (B) Histogram showing the frequency distribution of distances between identified motifs and ChIP-seq peak centers. The dashed line indicates the peak center position. (C) Sequence logo (86) of the enriched sequence motif associated with TSSs located within 20 bp of RpoS ChIP-seq peak centers (MEME E value, 3 × 10−56). Note that only a subset of the motif identified by MEME is shown, but positions outside the shown region all have information content values below 0.2. The sequence logo was generated using WebLogo (87). Numbers below the motif refer to positions relative to the transcription start, based on known sequence preferences for RpoS (22).

