FIG 1.
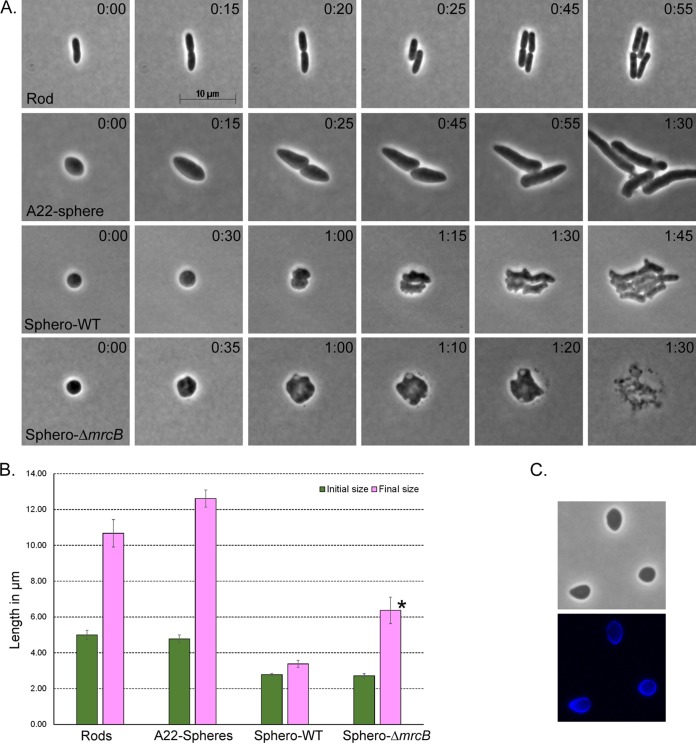
Shape reconstruction in spheroplasts begins with cell division. (A) Time-lapse microscopic examination of the normal cell cycle of a rod (n = 4), A22-induced spheres (n = 11), and lysozyme-induced spheroplasts from wild-type (WT) E. coli (Sphero-WT; n = 5) or a PBP1B-deficient mutant (Sphero-ΔmrcB; n = 4). The time after plating (in hours:minutes) is displayed in the upper right corner of each panel. (B) Graphical comparison of cell sizes during the growth cycle of rods and the recovery phase of spherical cells. The initial size is the cell length immediately after the spheroplasts were plated onto the agar pad; the final size is the maximum cell length prior to division. Error bars represent standard deviations. *, PBP1B-deficient spheroplasts (Sphero-ΔmrcB) never divided but instead enlarged to about twice their original diameter before lysing. (C) A22-induced spheres were labeled with the fluorescent d-alanine derivative HADA. (Top) phase image; (bottom) fluorescent image.

