Figure 3.

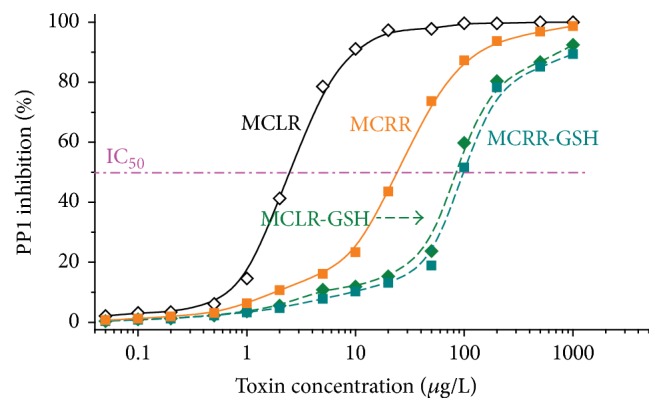
Inhibition curves for MCLR, MCRR, and related MCLR-DBPs on PP1. IC50 for MCLR, MCRR, MCLR-GSH, and MCRR-GSH on PP1 were about 2.5 ± 0.2 μmol/L, 24.4 ± 0.5 μmol/L, 86.6 ± 1.2 μmol/L, and 98.7 ± 1.0 μmol/L, respectively.

Inhibition curves for MCLR, MCRR, and related MCLR-DBPs on PP1. IC50 for MCLR, MCRR, MCLR-GSH, and MCRR-GSH on PP1 were about 2.5 ± 0.2 μmol/L, 24.4 ± 0.5 μmol/L, 86.6 ± 1.2 μmol/L, and 98.7 ± 1.0 μmol/L, respectively.