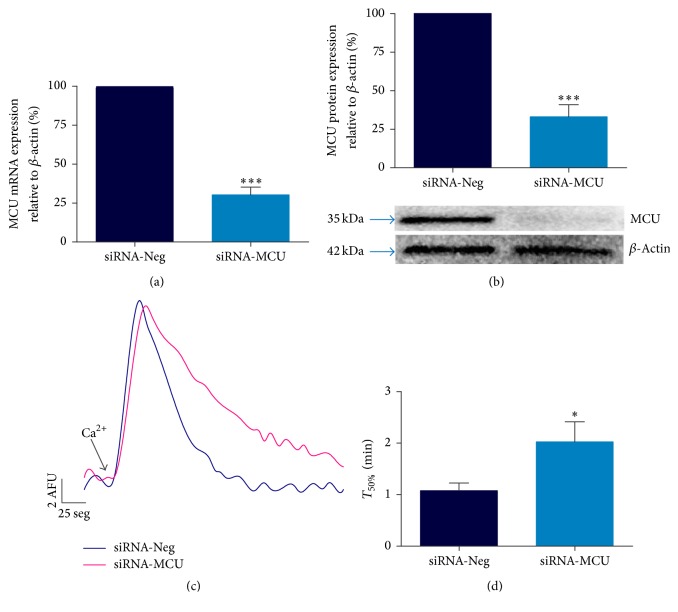
Figure 3.
MCU silencing reduces mitochondrial Ca2+ transport. (a) MCU mRNA expression by semiquantitative qRT-PCR in silenced cardiomyocytes, ∗∗∗P < 0.001 versus siRNA-Neg, mean ± SEM, n = 7. (b) MCU protein expression, with β-actin used as a loading control. ∗∗∗P < 0.001 versus siRNA-Neg, mean ± SEM, n = 6. (c) Representative traces of mitochondrial Ca2+ uptake in permeabilized MCU-silenced cardiomyocytes using CG-5N Ca2+ indicator after 15 μM Ca2+ addition. The experiment was performed in the presence of 1 μM CsA. AFU, arbitrary fluorescence units. (d) Time to 50% decay analysis (T50%) of mitochondrial Ca2+ transport. ∗P < 0.05 versus siRNA-Neg, mean ± SEM, n = 6. MCU silencing conditions were using 225 nM of siRNA-MCU at 96 h of transfection.

