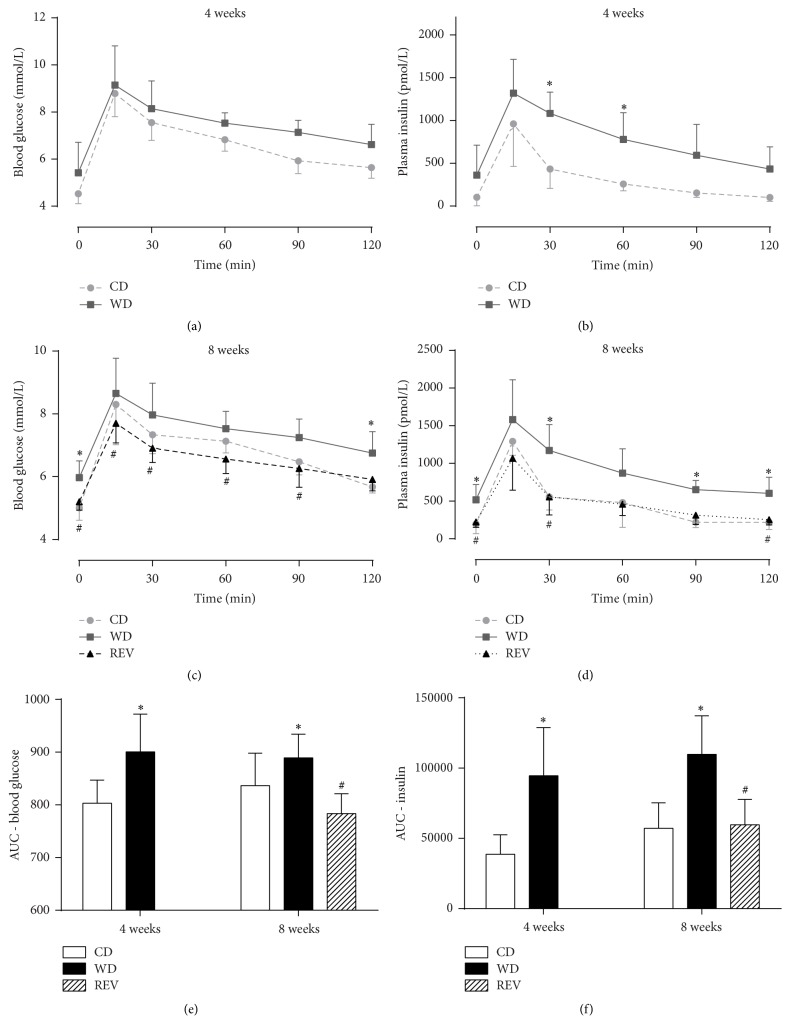
Figure 2.
Glucose tolerance after diet feeding without sevoflurane exposure. Blood glucose (a, c), insulin (b, d) levels, and area under the curve (AUC; e, f) during an oral glucose tolerance test in rats after 4 and 8 weeks of control diet (CD), western diet (WD), or diet reversion (REV) feeding. Data are mean ± SD, n = 6, Student's t-test, one- and two-way ANOVA with repeated measures, and Bonferroni post hoc analyses, ∗p < 0.05 versus CD and #p < 0.05 versus WD.

