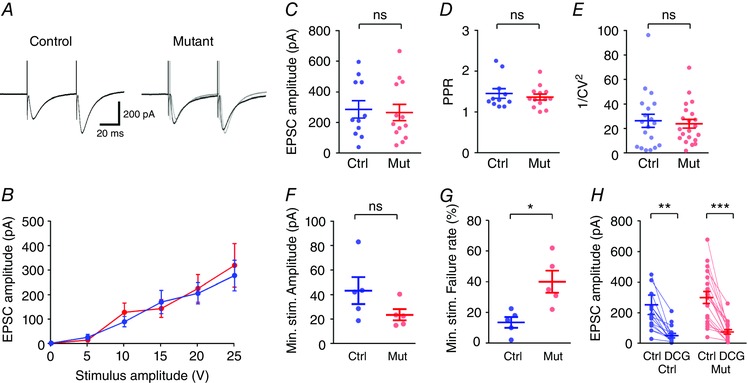
Figure 5. Basal synaptic transmission at the MFB is normal in the COX10‐deficient mouse.

A, representative traces showing EPSCs elicited in response to str. lucidum stimulation under paired‐pulse protocols for control (left) and COX10‐deficient mice (right); control traces are shown in grey for comparison. B, there was no difference in the input–output relationship between control (blue) and mutant mice (red). C–E, EPSC amplitude (C), paired‐pulse ration (D) and 1/CV2 (E) all showed no difference between control and mutant mice. F, minimal stimulation of str. lucidum resulted in unitary EPSCs in CA3 PCs, of which there was no observable difference in amplitude between genotypes. G, the failure rate of unitary connections was quantified for control and COX10‐deficient mice. H, evoked EPSCs in all cells recorded were strongly inhibited by bath application of DCG‐IV (5 μm). Statistics shown: ns, P > 0.05; * P < 0.05; ** P < 0.01; *** P < 0.001.
