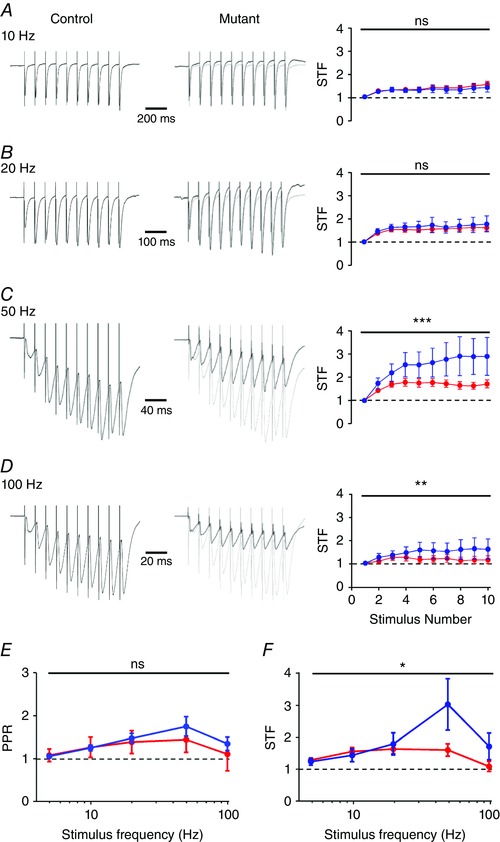
Figure 6. COX10‐deficient MF terminals show deficits in short‐term plasticity at high frequencies.

A–D, representative trains of 10 stimuli delivered at 10–100 Hz (indicated) to str. lucidum from control (left) and COX10‐deficient (middle) mice; note traces are scaled to the peak amplitude of the first EPSC. Right, the degree of short‐term facilitation (STF) as measured as EPSC amplitude compared to the first EPSC. Data are shown for control (blue) and COX10‐deficient mice (red); note that EPSCs recorded in CA3 PCs do not show sustained facilitation at high frequencies. E, quantification of paired pulse ratio (PPR; second to first EPSC) over the range of frequencies tested. F, STF ratio as measured as last to first EPSC as measured over the same frequency range. Note the strong depression of STF from 20 to 100 Hz. Statistics shown: ns, P > 0.05; * P < 0.05; ** P < 0.01; *** P < 0.001.
