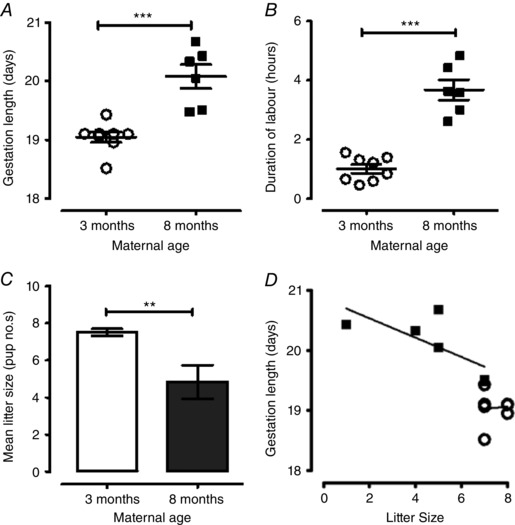
Figure 1. Influence of maternal age on gestation length, labour duration and litter size.

A, scatter graph presenting individual gestation lengths in 3‐month‐old (n = 8, open circles) and 8‐month‐old (n = 6, closed squares) pregnant mice. Gestation was longer in 8‐month‐old mice (*** P < 0.001). B, scatter graph presenting individual labour durations in 3‐month‐old (n = 8, open circles) and 8‐month‐old (n = 6, closed squares) pregnant mice. Parturition was longer in 8‐month‐old mice (*** P < 0.001). Horizontal bars indicate means and error bars indicate the SEM in both (A) and (B). C, litter size for 3‐month‐old (n = 8, open bar) and 8‐month‐old (n = 6, closed dark grey bar) pregnant mice. Litter size was reduced in 8‐month‐old mice (** P < 0.01). Data expressed as the mean ± SEM. Data were analysed using Student's t test for (A), (B) and (C). D, scatter plot and linear regression lines illustrating the relationship between gestation length and litter size in 3‐month‐old (n = 8, open circles) and 8‐month‐old (n = 6, closed squares) pregnant mice. There was no significant influence of litter size on gestation length (3‐month slope: 0.04 ± 0.19, r 2 = 0.007, P = 0.848; 8‐month slope: –0.16 ± 0.08, r 2 = 0.523, P = 0.104).
