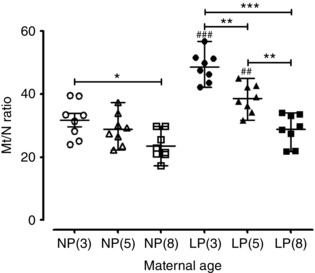
Figure 9. mtDNA copy number ratio (Mt/N) declines by the influence of maternal age the in non‐pregnant and late pregnant mouse myometrium.

Scatter graph depicting Mt/N in the myometrium from non‐pregnant 3‐month‐old [NP(3), n = 8, open circles], non‐pregnant 5‐month‐old [NP(5), n = 8, open triangles], non‐pregnant 8‐month‐old [NP(8), n = 8, open squares], late pregnant 3‐month‐old [LP(3), n = 8, closed circles], late pregnant 5‐month‐old [LP(5), n = 8, closed triangles] and late pregnant 8‐month‐old [LP(8), n = 8, closed squares] mice. Mt/N was significantly reduced by the influence of age between NP(3) and NP(8) myometrium (* P < 0.05), LP(3) and LP(8) myometrium (*** P < 0.001), LP(3) and LP(5) myometrium (** P < 0.01) and LP(5) and LP(8) myometrium (** P < 0.01). Mt/N was increased by the influence of pregnancy between NP(3) and LP(3) myometrium (### P < 0.001) and NP(5) and LP(5) myometrium (## P < 0.01). Data were analysed using ANOVA followed by an all pairwise multiple comparison Tukey's test and are presented as the mean ± SEM.
