
Figure 2. The formation N‐cadherin AJs was sensitive to changes in transmural pressure in SCAs.
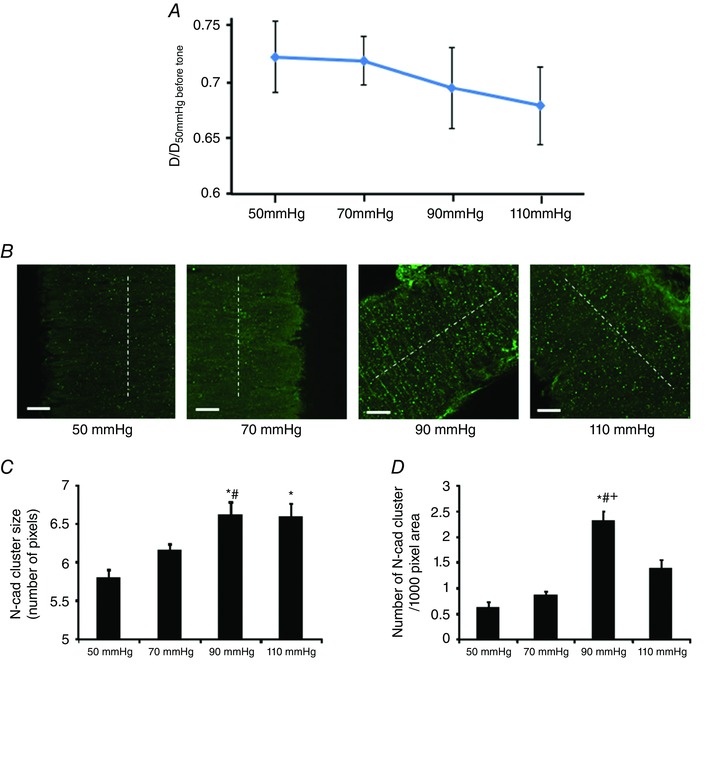
A, SCAs developed myogenic tone before undergoing paraformaldehyde fixation. Vessel diameter was normalized to the initial passive diameter of the vessel at 50 mmHg. Number of vessels: 50 mmHg, n = 5; 70 mmHg, n = 6; 90 mmHg, n = 7; 110 mmHg, n = 7. B, N‐cadherin clusters in the vessel wall. Note the increase of clustering at 90 and 110 mmHg compared to 50 mmHg. White dashed lines indicate the direction of vessel orientation. C and D, both N‐cadherin cluster size and density were significantly changed when the pressure was increased. Pixel size is 0.16 μm 2. Confocal z‐stack images of the vessel wall were collected vy through‐focus imaging, and the image stack was quantitatively analysed to determine the average density and size of N‐cadherin clusters in the VSMC layer. 50 mmHg, n = 5 vessels; 70 mmHg, n = 6 vessels; 90 mmHg, n = 7 vessels; 110 mmHg, n = 7 vessels. One vessel was used for each animal (i.e. the number of vessels n equals the number of animals used for each experiment). * P < 0.05 compared to 50 mmHg; #P < 0.05 compared to 70 mmHg; +P < 0.05 compared to 110 mmHg. Scale bar = 20 μm. Data are presented as the mean ± SE. [Color figure can be viewed at wileyonlinelibrary.com]