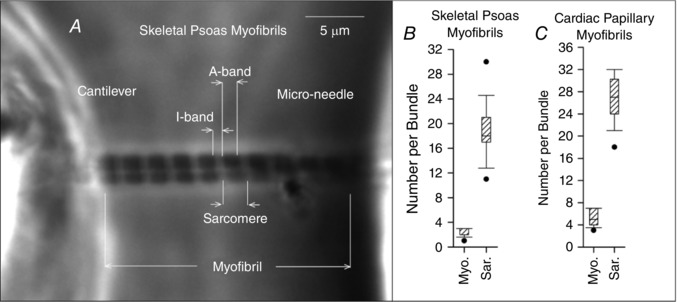
Figure 2. Summary of initial conditions in the experiments with myofibrils.

A, example of a bundle of 2 skeletal psoas myofibrils suspended between a cantilever and micro‐needle with a resting SL of 2.16 μm. To the right of the image, box plots summarize the number of myofibrils and sarcomeres per tested bundle for the skeletal psoas myofibrils (B) and the cardiac papillary myofibrils (C).
