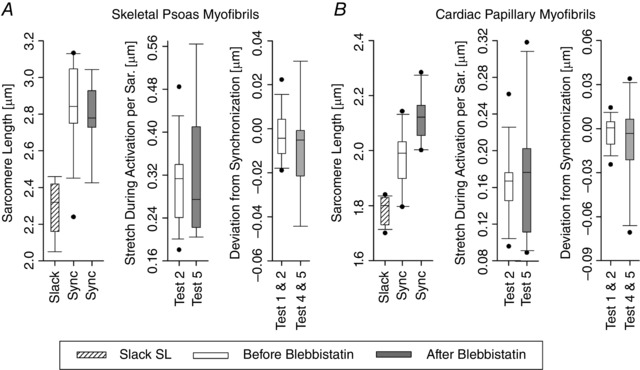
Figure 3. Box plots of the skeletal psoas myofibrils (A) and cardiac papillary myofibrils (B) summarizing the resting SL, the synchronization SL, the amount of stretch during activation, and the amount the SL deviated from the synchronization SL after the stretch during activation.

Note that 14 skeletal and 10 cardiac experimental sets were performed. After treating the myofibril with Blebbistatin, 9 skeletal and 10 cardiac experimental sets were performed.
