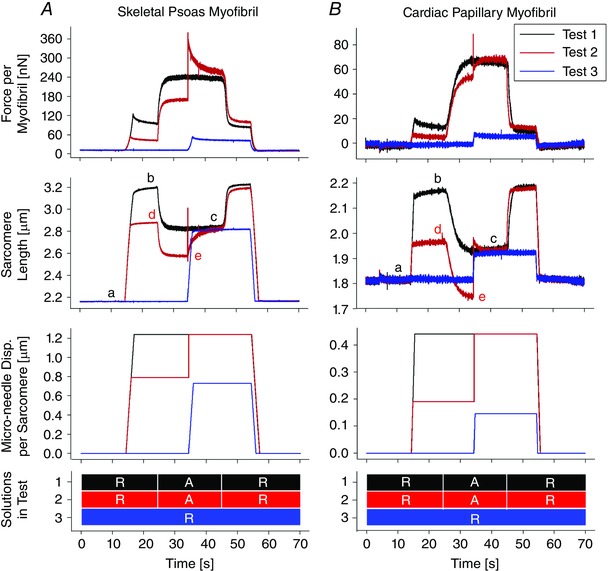
Figure 4. Plots representing the first three tests on a skeletal psoas myofibril (A) and a cardiac papillary myofibril (B).

The SL plots are annotated with letters a–e with the synchronization SL (c) denoting the period when forces were compared. The micro‐needle input and solutions exchanged are plotted to clarify the time period they were applied. ‘R’ and ‘A’ indicate the use of relaxation solution and activation solution, respectively.
