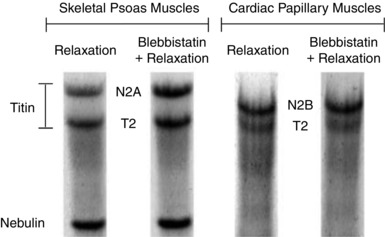
Figure 10. Relevant sections of the electrophoresis agarose gel for each of the skeletal psoas muscles and cardiac papillary muscles.

Each muscle was incubated in two columns with different solutions: a relaxation solution and a Blebbistatin solution mixed with relaxation solution. The gel shows the skeletal titin isoform (N2A) and the cardiac titin isoform (N2B). Note that the T2 bands result from normal degradation of titin (Linke & Fernandez, 2002; Neagoe et al. 2003; Fujita et al. 2004; Lahmers et al. 2004). Furthermore, the nebulin bands are below the T2 bands in the skeletal psoas columns, but not in the cardiac papillary columns.
