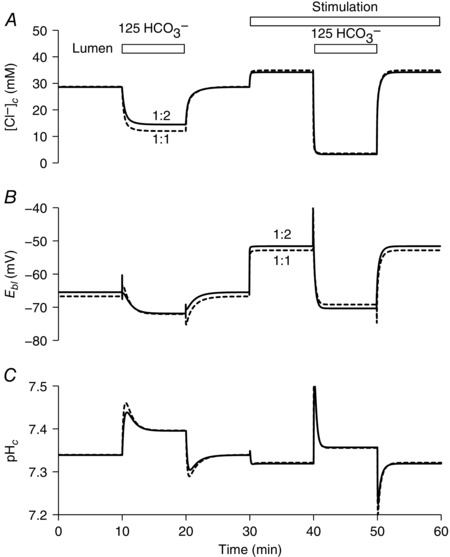
Figure 3. Changes in key variables in the perfused duct model evoked by cAMP stimulation and exposure to high luminal HCO3 − concentration.

Time course of changes in intracellular Cl− concentration ([Cl−]c) (A), basolateral membrane potential (E bl) (B) and intracellular pH (pHc) (C). The lumen is perfused initially with the normal HCO3 − solution (containing 25 mm HCO3 − and 124 mm Cl−). At 10 and 40 min, the luminal perfusate is switched to a high‐HCO3 − solution (125 mm HCO3 − and 24 mm Cl−) for 10 min. Transporter activities are altered from 30 min to represent cAMP stimulation. The solid and dashed lines show the slightly different predictions for the 1:2 and 1:1 Cl−:HCO3 − stoichiometries of the SLC26A6 exchanger.
