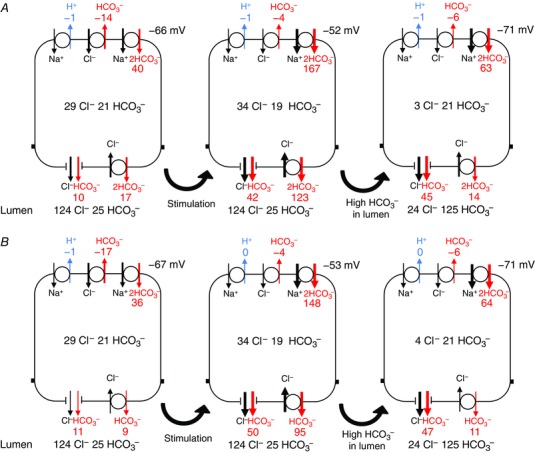
Figure 4. Steady‐state HCO3 − fluxes in the perfused duct model at rest, and following cAMP stimulation and elevation of the luminal HCO3 − concentration.

Steady‐state fluxes of HCO3 − mediated by (clockwise from top left) NHE1, AE2, NBC1, SLC26A6 and CFTR. Fluxes correspond to the steady‐state values attained in Fig. 3. Results are shown for both the 1:2 Cl−:HCO3 − stoichiometry of SLC26A6 (A) and for the 1:1 stoichiometry (B). In each case, the first panel represents the unstimulated duct perfused with the normal 25 mm HCO3 − solution, the second panel shows the effect of altering the transporter activities to represent cAMP stimulation, and the third panel shows the effect of raising the luminal HCO3 − concentration to 125 mm. Fluxes are given in nmol min−1 cm−2. Also shown are the steady‐state intracellular concentrations of Cl− and HCO3 − (mm) and the basolateral membrane potential. [Color figure can be viewed at wileyonlinelibrary.com]
