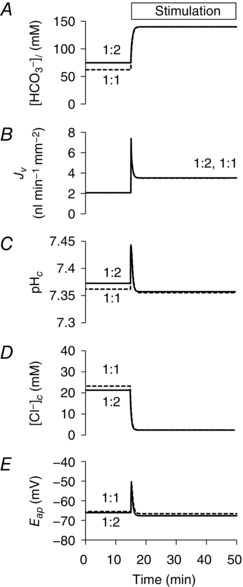
Figure 5. Changes in key variables in the secreting duct model following cAMP stimulation.

Time course of changes in secreted HCO3 − concentration ([HCO3 −]l) (A), secretory volume flow (J v) (B), intracellular pH (pHc) (C), intracellular Cl− concentration ([Cl−]c) (D) and apical membrane potential (E ap) (E). Transporter activities are altered from 15 min to represent cAMP stimulation. The solid and dashed lines show the slightly different predictions for the 1:2 and 1:1 Cl−:HCO3 − stoichiometries of the SLC26A6 exchanger.
