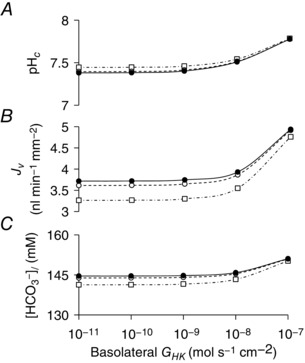
Figure 10. Effect of basolateral and apical H+,K+‐ATPase activity on key variables in the secreting duct model.

Steady‐state values in the stimulated condition of intracellular pH (pHc) (A), secretory volume flow (J v) (B), and secreted HCO3 − concentration ([HCO3 −]l) (C) for a range of basolateral and apical H+,K+‐ATPase activities (G HK). Curves are plotted against basolateral G HK (abscissa) for three different apical G HK values: 10−10 (filled circles), 10−8 (open circles) and 10−7 mol s−1 cm−2 (open squares). The Cl−:HCO3 − stoichiometry of the SLC26A6 exchanger was assumed to be 1:2.
