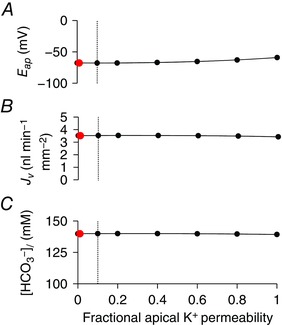
Figure 11. Effect of varying the distribution of K+ permeability between apical and basolateral membranes on key variables in the secreting duct model.

Steady‐state values in the stimulated condition of apical membrane potential (E ap) (A), secretory volume flow (J v) (B) and secreted HCO3 − concentration ([HCO3 −]l) (C) for a range of apical K+ permeability values expressed as a fraction of the whole‐cell K+ permeability, which was maintained at a constant value. The red data points show the value (0.01) used for optimization. The vertical dotted lines show the maximum value (0.1) estimated for rat pancreatic duct cells (Novak & Greger, 1991). The Cl−:HCO3 − stoichiometry of the SLC26A6 exchanger was assumed to be 1:2. [Color figure can be viewed at wileyonlinelibrary.com]
