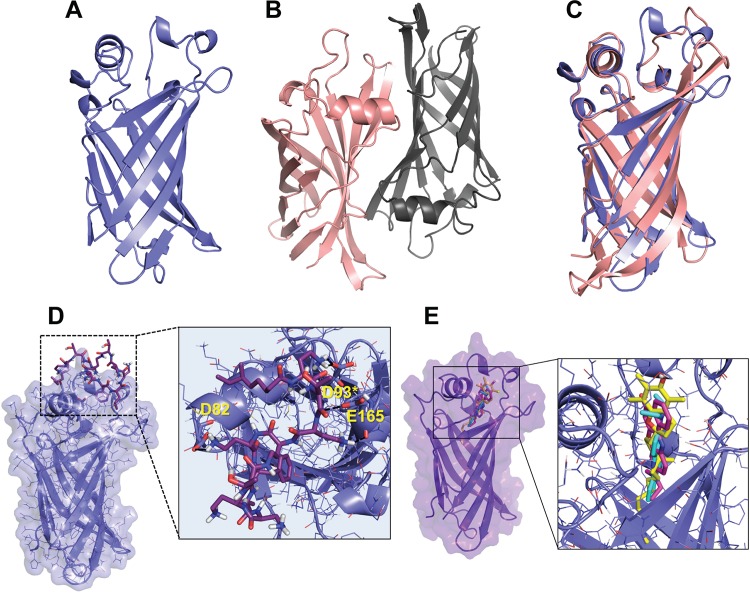
FIG 4 .
Structural analysis of BcnA and BcnB and ligand docking modeling. (A) BcnA (blue) is a monomer. (B) BcnB (protomer 1, chain C, peach; protomer 2, chain D, gray) is a dimer. (C) Superposition of BcnA and BcnB with dissimilar tunnel opening loops boxed. (D) Docked structure of PmB in complex with the BcnA crystallographic structure. (E) Docking model presenting the superimposition of the two best predicted binding modes of Nile red (magenta and cyan) and α-tocopherol (yellow) when docked into the BcnA crystallographic structure.

