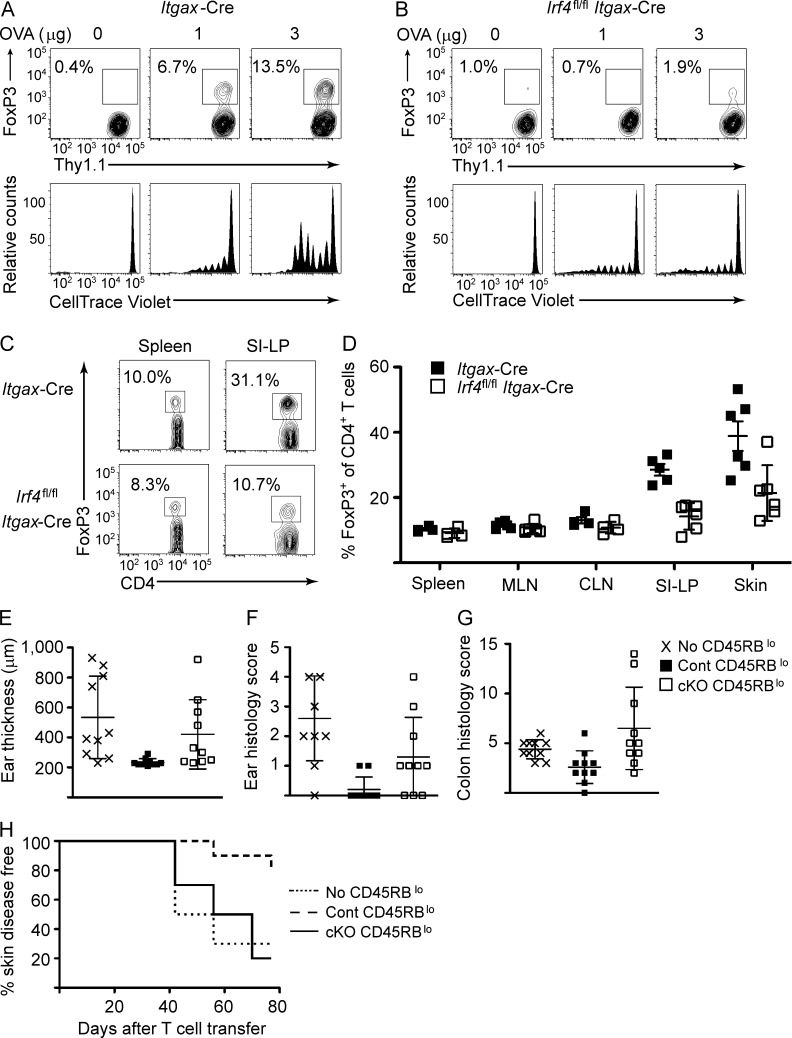
Figure 4.
Impaired peripheral tolerance in Itgax-Cre Irf4fl/fl mice. (A and B) Purified, CellTrace Violet–labeled Thy1.1+ OT-II T cells were transferred into Itgax-Cre or Itgax-Cre Irf4fl/fl mice. Recipient mice were challenged subcutaneously with the indicated doses of ovalbumin. 5 d after Ag challenge, cutaneous lymph nodes were collected and analyzed by flow cytometry for OT-II proliferation (bottom) and FoxP3 expression (top). (C and D) Spleen, mesenteric and cutaneous lymph nodes, small intestine lamina propria, and skin were collected from Itgax-Cre and Itgax-Cre Irf4fl/fl mice. (C) Endogenous CD4+ T cell populations were analyzed by flow cytometry for FoxP3 expression. Numbers indicate percentage FoxP3+ within adjacent gate. Representative data from spleen and small intestine lamina propria are shown. (D) Cumulative data from several independent analyses are provided. Symbols represent individual mice. Errors bars represent mean ± SD. (E–H) CD45RBhi CD4+ T cells were sorted from Itgax-Cre mice and transferred into RAG1−/− recipients alone or with Itgax-Cre (Cont) CD45RBlo CD4+ T cells or Itgax-Cre Irf4fl/fl (cKO) CD45RBlo CD4+ T cells. (E) Ear thickness measured by caliper at the completion of the study. (F and G) Pathology disease scoring for ear (F) and colon (G) tissue collected at the completion of the study. (E–G) Error bars represent mean ± SD. (H) Kaplan–Meyer curve for incidence of skin disease over the course of the study.

