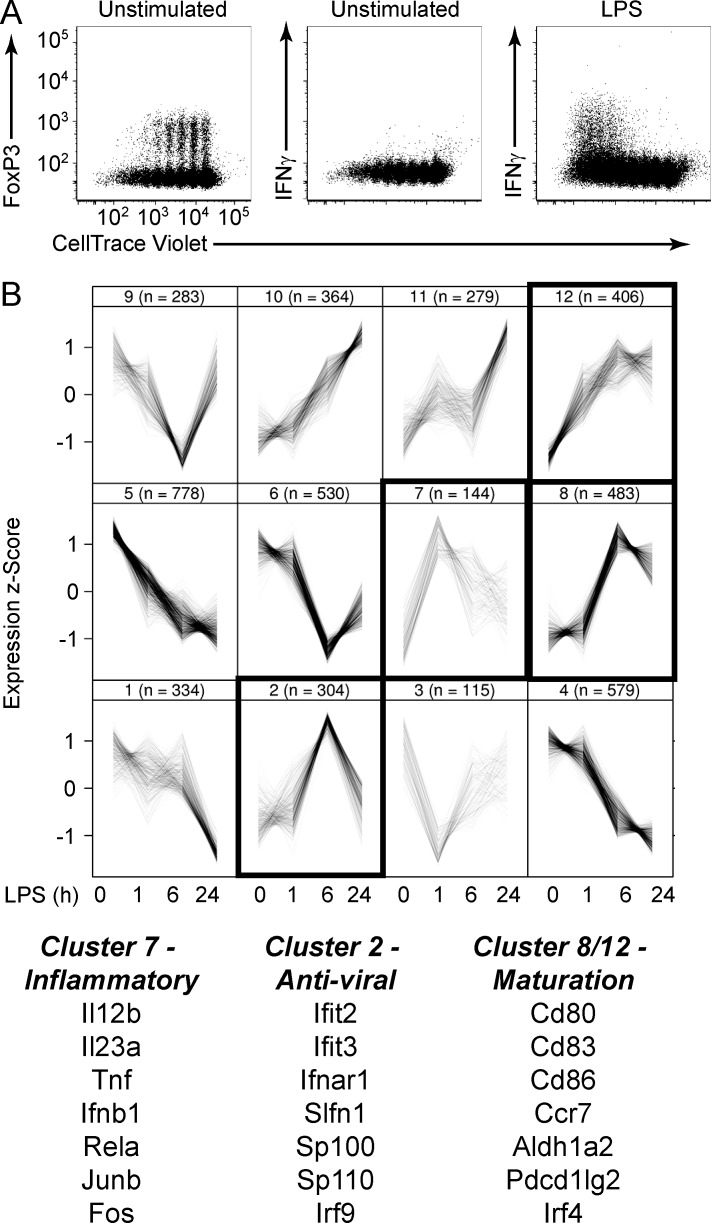
Figure 5.
In vitro model for functionally divergent maturation programs. (A) Ovalbumin-loaded BMDCs were left unstimulated or stimulated with LPS and then co-cultured with CellTrace Violet–labeled naive OT-II T cells for 5 d. T cells were subsequently analyzed by flow cytometry for dye dilution and expression of FoxP3 and IFNγ. Data are representative of more than three experiments. (B) BMDCs were stimulated with LPS for 0, 1, 6, and 24 h, and microarray gene expression analysis was performed. Data were compiled for three independent experiments. LPS-regulated genes were organized into 12 clusters according to similar kinetic profiles. Cluster 7 showed a strong inflammatory signature, whereas cluster 2 showed a strong antiviral signature. Clusters 8 and 12 included genes encoding costimulatory and regulatory signals. Representative genes of interest within each module are annotated. Numbers in parentheses indicate number of genes assigned to that module. Traces within each box represent mean expression of individual genes averaged over three experiments at the indicated time points after stimulation.

