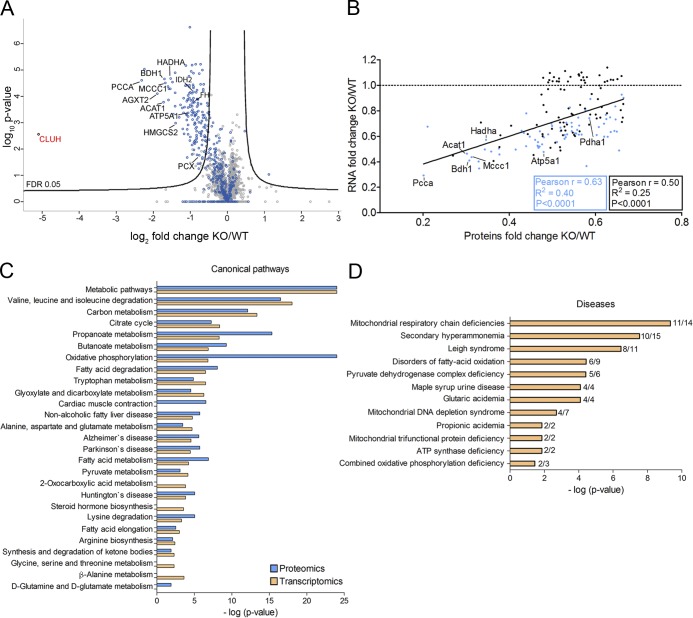
Figure 2.
Protein and transcript levels of a subset of nuclear-encoded mitochondrial proteins are down-regulated in Cluh−/− livers. (A) Volcano plot of proteomics analyses of livers of E18.5 KO mice compared with WT. Names are indicated for all proteins relevant in the following experiments. Blue dots are mitochondrial proteins according to Mitocarta 2.0; gray dots indicate nonmitochondrial proteins. (B) Correlation of the abundance of significantly down-regulated proteins (FC ≥1.5) with corresponding transcript levels. Previously identified CLUH targets (Gao et al., 2014) are indicated in blue. The black line shows correlation regression of all genes. The black box shows statistics for all genes, and the blue box shows statistics only for identified CLUH targets. Names are indicated for genes for which mRNA stability is measured in the following experiments. The dashed line marks an RNA FC of 1. (C) Significantly enriched pathways highlighted by proteomics (blue) and transcriptomics (orange) data. (D) Disease implication analysis of proteomics data. In C and D, bars indicate log of p-values.

