Figure 8.
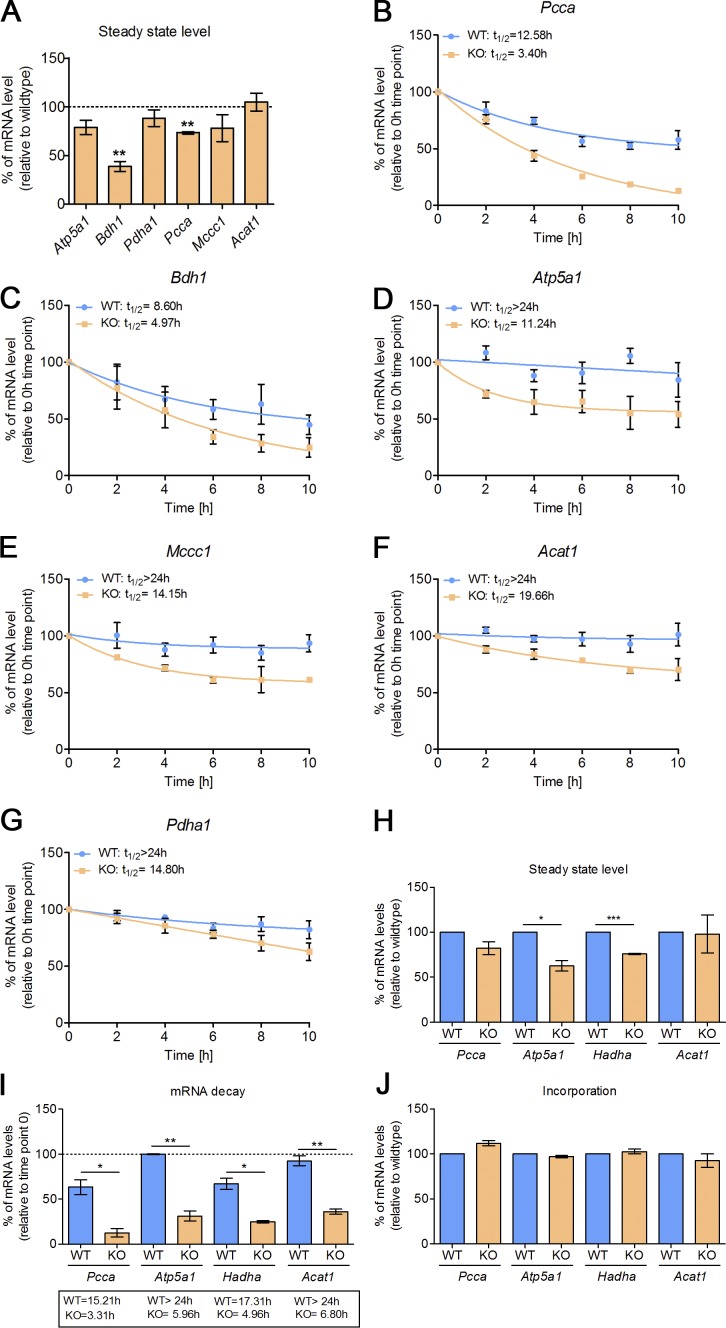
CLUH controls the stability of target mRNAs. (A) Steady-state levels of mRNAs of KO cells relative to WT cells (dashed line) from experiments shown in B–G at time point 0. (B–G) Nonlinear regression decay trendlines of indicated mRNAs at different time points after actinomycin D treatment in WT and KO MEFs relative to time point 0. Calculated half-lives are indicated. Expression was normalized to GAPDH levels. (H) Steady-state levels of the indicated mRNAs in KO cells relative to WT levels from the experiment shown in I and J at time point 0 of whole-cell RNA. (I) Relative mRNA levels of pulled-down EU-incorporated mRNAs after 10-h chase relative to the corresponding time point 0 (dashed line). *, P ≤ 0.05; **, P ≤ 0.01; ***, P ≤ 0.001 (two-tailed t test). Calculated half-lives are indicated. (J) Relative mRNA levels of pulled down EU-incorporated mRNAs at time point 0 of KO cells relative to WT levels. Expression was normalized to GAPDH levels. Graphs represent means ± SEM. n = 3.

