Figure 5.
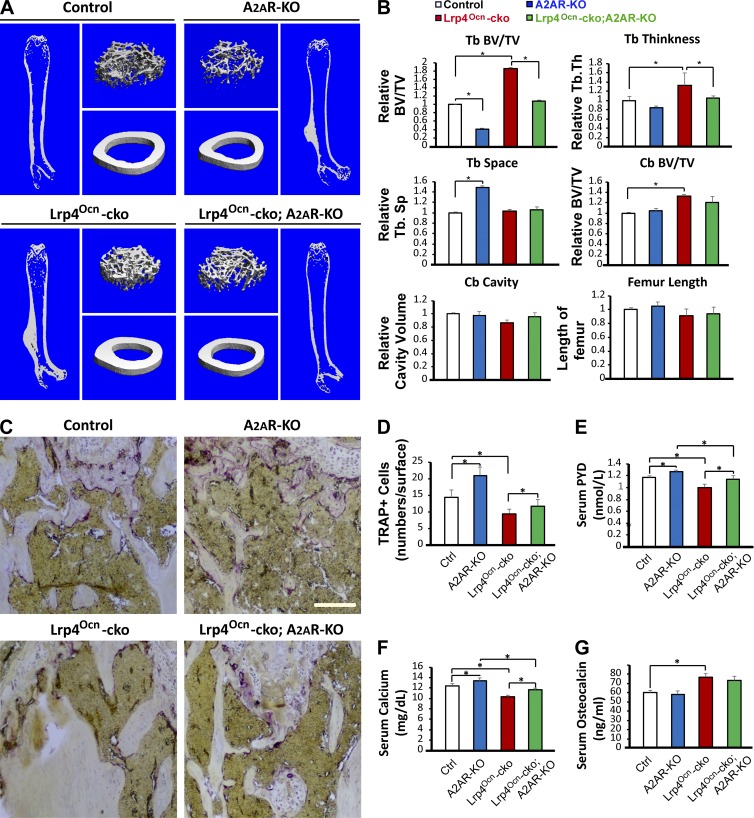
Diminished high-bone-mass phenotype in Lrp4Ocn-cko mice by A2AR knockout. The femurs and sera samples collected from 3-mo-old control (Ocn-Cre), A2AR-KO, Lrp4Ocn-cko, and Lrp4Ocn-cko;A2AR-KO mice were subjected to µCT and ELISA/RIA analyses. (A and B) µCT analysis. Five different male mice of each genotype per group were examined blindly. Representative 3D images are shown in A. Quantification analyses of trabecular bone (TB) volumes over total volumes (BV/TV), TB thickness (TB. Th), TB space (Tb. Sp), cortical bone (CB) BV/TV, CB cavity, and femur length by direct model of µCT analysis are presented in B. Data were analyzed by two-way ANOVA; *, P < 0.05. (C and D) TRAP staining analysis. Representative images are shown in C. Bar, 50 µm. Quantification analysis (mean ± SD, n = 5 femur samples for each group) are shown in D. (E–G) RIA analyses of serum PYD and Ocn, and colorimetric analysis of serum calcium levels. Values are presented as mean ± SD (n = 5). *, P < 0.05.

