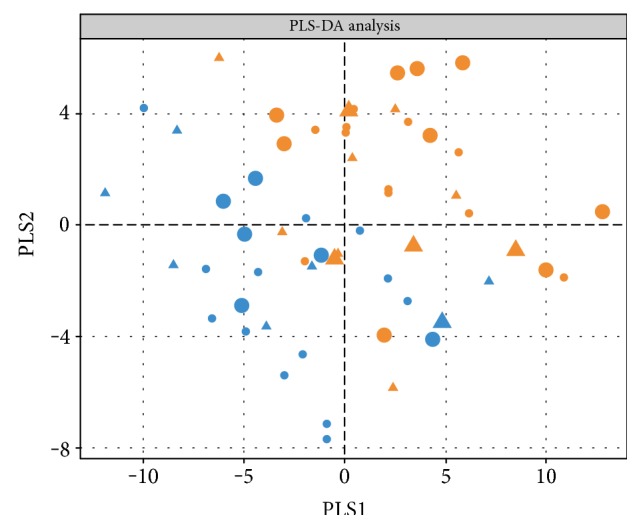
Figure 1.

CAD patients separated from non-CAD subjects. PLS-DA (partial least squares discriminant analysis) results are shown. Subjects with CAD are depicted in yellow and subjects without CAD in blue; medication intake is displayed as insulin therapy (circle) or oral antidiabetic agent intake (triangle); sex differences are highlighted in the size of the symbols: females (larger) and males (smaller).
