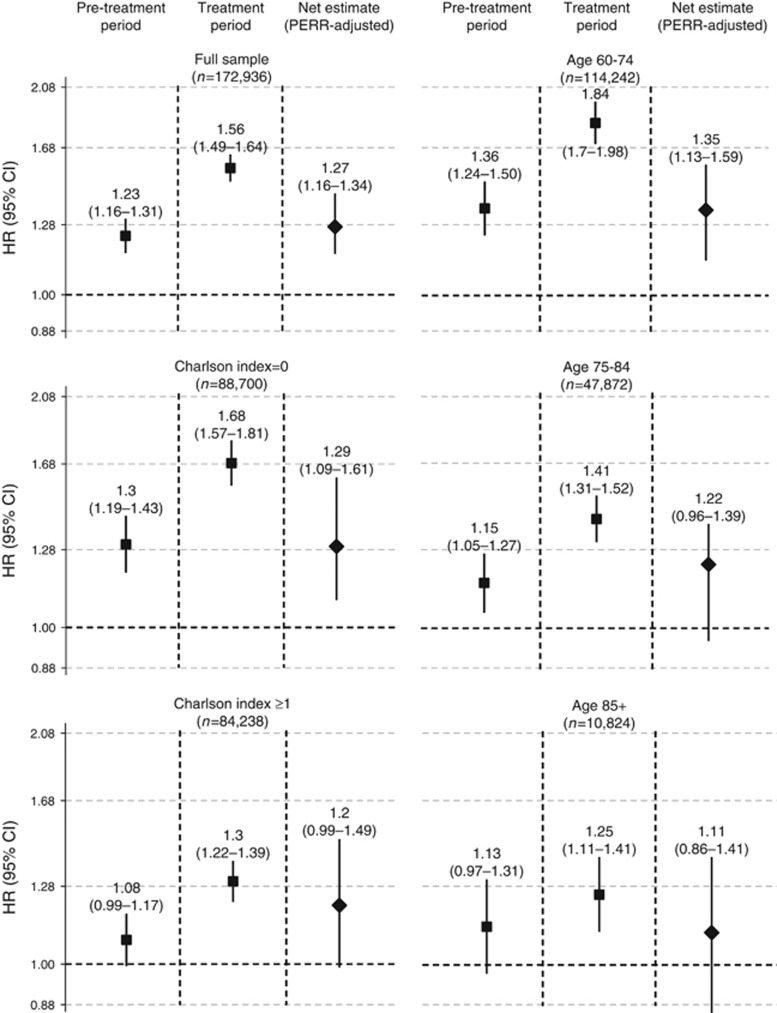
Figure 1.
Hazard ratios for pre-treatment and treatment periods, and PERR-adjusted hazard ratios for the full sample and by comorbidity and age groups (log-scale). Confidence intervals for PERR analyses were calculated using bootstrapping techniques. 95%CI, 95% confidence interval; CCI, Charlson Comorbidity Index; HR, hazard ratio; HRPERR=HRTreatment period/HRPre-treatment period; PERR, Prior Event Rate Ratio.

