-
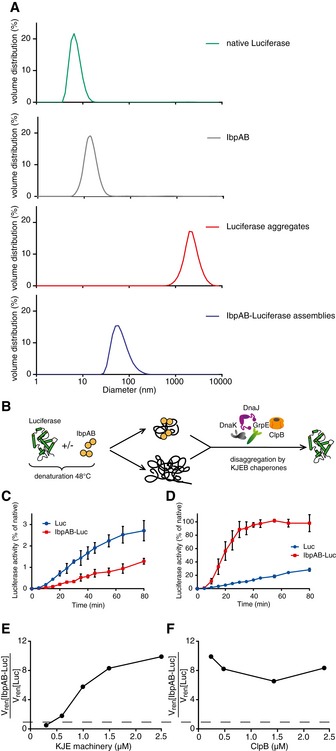
A
Dynamic light scattering graphs depicting the size distribution of the following entities: native luciferase (green), IbpAB (grey), luciferase aggregates (red), IbpAB–luciferase assemblies (blue), shown as volume distribution of analysed species. Luciferase was present at 1.5 μM, IbpA at 3 μM, IbpB at 7 μM concentration.
-
B
Scheme of the disaggregation experiment.
-
C, D
Renaturation kinetics for luciferase denatured in the presence or absence of IbpAB. Luciferase (1.5 μM) was denatured in the presence of IbpA (3 μM) and IbpB (7 μM), diluted to 40 nM and refolded at limited (0.3 μM; C) or elevated (2.4 μM; D) KJE machinery concentrations and standard (1.5 μM) ClpB concentration. The KJE machinery concentration is given with respect to DnaK with a constant DnaK:DnaJ:GrpE ratio 1:0.3:0.3. Data are the mean ± SD of three independent experiments.
-
E
A comparison of renaturation rates for luciferase denatured in the presence or absence of IbpAB in changing KJE and constant ClpB concentrations. The KJE machinery concentration is given with respect to DnaK with a constant DnaK:DnaJ:GrpE ratio 1:0.3:0.3.
-
F
A comparison of renaturation rates for luciferase denatured in the presence or absence of IbpAB in changing ClpB and constant KJE concentrations. The dashed line indicates the theoretical scenario that luciferase refolding from aggregates and sHsp assemblies proceeds with identical refolding rates.

