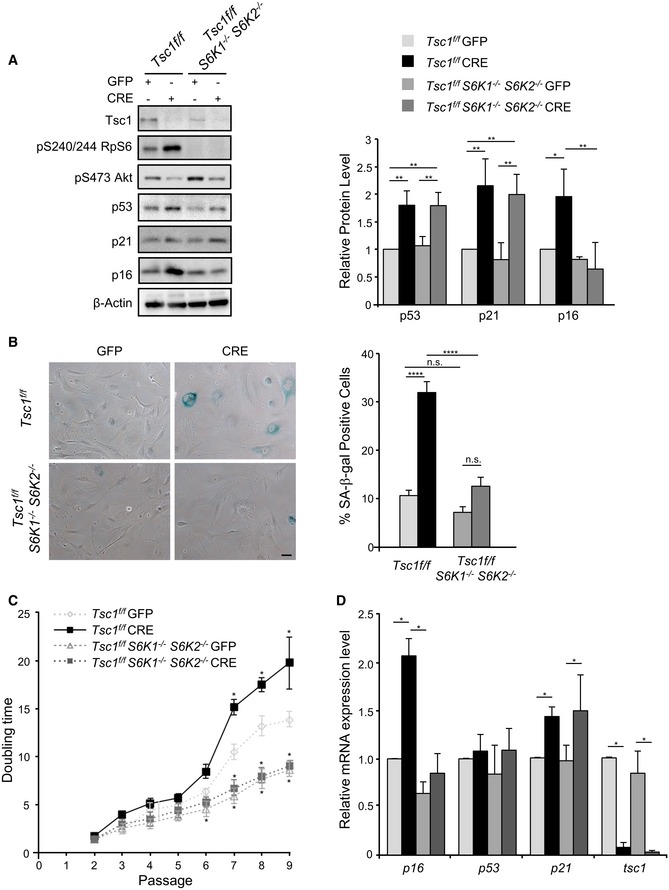
Figure 1. S6 kinases control p16 expression and the senescence response in TSC1 mutant cells.

- Immunoblot analysis of Tsc1 fl/fl and Tsc1 fl/fl S6K1 −/− S6K2 −/− primary MEFs transduced with GFP or GFP‐Cre adenovirus and harvested from 9 to 12 days post‐infection (passage P6 or P7). Proteins were analysed by Western blot using the indicated antibodies. Quantification by densitometric analyses of p53, p21 and p16 protein levels is presented as a graph. Data are normalized to β‐actin and expressed as a fold change relative to the control cells. Data are presented as mean ± SD of at least three independent experiments. *P < 0.05, **P < 0.01, ANOVA multiple comparisons.
- Bright‐field images of β‐galactosidase staining performed on Tsc1 fl/fl and Tsc1 fl/fl S6K1 −/− S6K2 −/− primary MEFs, transduced with GFP or GFP‐Cre adenovirus at passage P3 and fixed 12 days post‐infection, at passage P7. Scale bar: 50 μm. Data are presented in a graph as mean ± SEM of at least three independent experiments; ****P < 0.0001, n.s. not significant, ANOVA multiple comparisons.
- Population doubling analysis of Tsc1 fl/fl and Tsc1 fl/fl S6K1 −/− S6K2 −/− primary MEFs transduced at P1 with GFP or GFP‐Cre adenoviruses was determined for nine passages. Data are presented in the curve as mean ± SEM of at least three independent experiments; *P < 0.05, multiple t‐tests.
- Quantitative RT–PCR detection of the level of expression of the indicated genes in Tsc1 fl/fl and Tsc1 fl/fl S6K1 −/− S6K2 −/− primary MEFs transduced at P3 with GFP or GFP‐Cre adenovirus and collected at passage P7. Expression levels are corrected for expression of the control gene (β‐actin) and presented in the graph as fold changes relative to control cells. The values plotted are means ± SEM of three independent experiments; *P < 0.05, multiple t‐tests.
