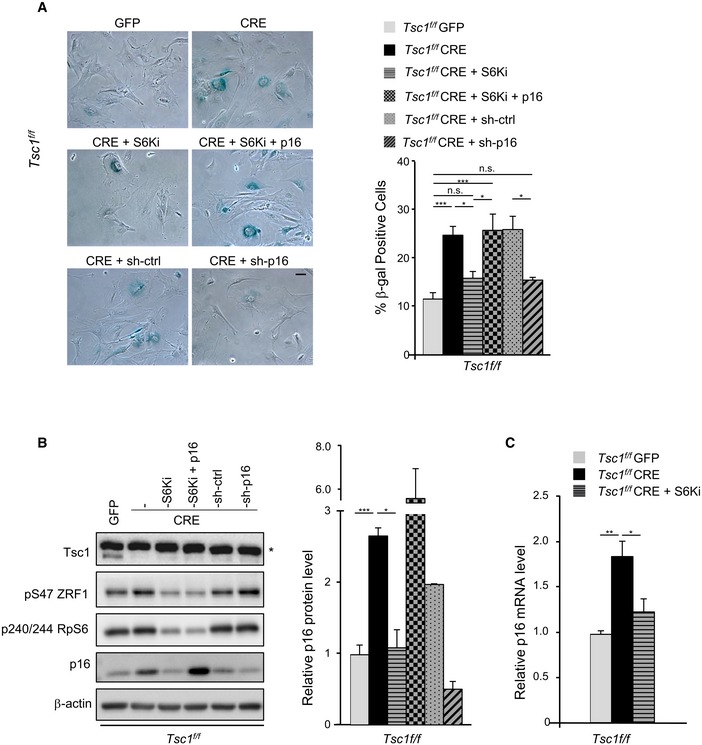
Figure 3. p16 expression modulates the senescence programme during TSC1 deletion or S6K inhibition.

- Representative bright‐field images of SA β‐galactosidase staining performed on cells fixed at passage P7. After Cre‐mediated TSC1 deletion, primary MEFs at passage P5 were treated with the S6K1 inhibitor PF‐4708671 (10 μM), treated with PF‐4708671 and simultaneously transduced with Adeno‐GFP‐p16 or transduced with LV‐sh‐p16 or LV‐sh‐Scramble, as control. PF‐4708671 or DMSO was added every 24 h. Scale bar: 50 μm. Quantification of β‐galactosidase‐positive cells was performed on three independent experiments and is shown in the graph on the right. Data are presented as mean ± SEM; *P < 0.05, ***P < 0.001, ANOVA multiple comparisons.
- Representative immunoblot analyses of MEF primary cells treated as in (A) and harvested at passage P7. * indicates unspecific band. Densitometric analyses of actin‐normalized signal are presented in a graph as fold changes relative to the control. Data are presented as mean ± SEM of three experiments. *P < 0.05, ***P < 0.001, two‐tailed, unpaired Student's t‐test.
- Relative transcript level of p16 of MEF primary cells treated as in (A) and harvested at passage P7. Data are presented as mean ± SEM of three experiments. *P < 0.05, **P < 0.01, ANOVA multiple comparisons.
