
Figure 3. Gene regulation by Pax5‐Etv6 and Pax5‐Foxp1 in pro‐B cells.
-
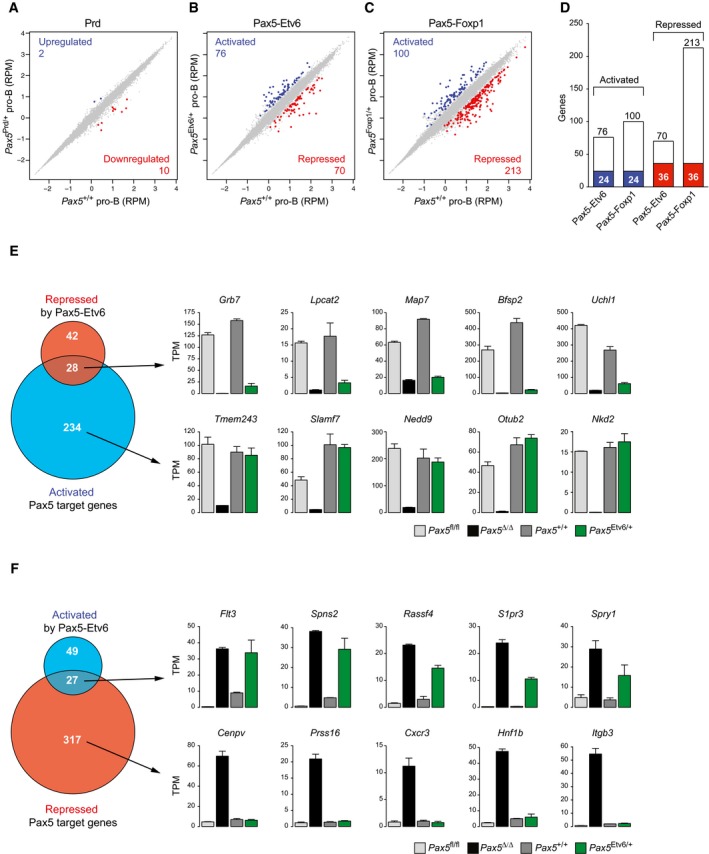
A–CScatter plot of gene expression differences between ex vivo sorted Pax5 +/+ and Pax5 Prd/+ (A), Pax5 Etv6/+ (B), or Pax5 Foxp1/+ (C) pro‐B cells, based on four (Pax5 Etv6/+) or two (other genotypes) independent RNA‐seq experiments. The normalized expression data of individual genes (indicated by dots) were plotted as RPM values. Genes with an expression difference of > threefold, an adjusted P‐value of < 0.05 (DESeq2), and a TPM value of > 5 (in one of the two cell types) are colored in blue or red, corresponding to activation (upregulation) or repression (downregulation) by Prd, Pax5‐Etv6, or Pax5‐Foxp1, respectively.
-
DOverlap of Pax5‐Etv6‐ and Pax5‐Foxp1‐regulated genes in pro‐B cells. Commonly activated or repressed genes are indicated by blue and red bars, respectively.
-
EVenn diagram indicating the overlap between activated Pax5 target genes (Revilla‐i‐Domingo et al, 2012) and Pax5‐Etv6‐repressed genes in pro‐B cells. The expression of genes indicated to the right was determined by RNA‐seq of in vitro cultured Pax5 fl/fl (light gray) and Vav‐Cre Pax5 fl/fl (Pax5∆/∆, black) pro‐B cells as well as ex vivo sorted Pax5 +/+ (dark gray) and Pax5 Etv6/+ (green) pro‐B cells. Gene expression is shown as normalized expression value (TPM) with SEM, based on at least two independent RNA‐seq experiments for each cell type. Notably, six activated Pax5 target genes, which were apparently “repressed” by Pax5‐Etv6, showed decreased expression already in response to a twofold reduction in full‐length Pax5 expression in Pax5 +/− pro‐B cells (Appendix Fig S1A).
-
FVenn diagram indicating the overlap between repressed Pax5 target genes and Pax5‐Etv6‐activated genes in pro‐B cells, as described in (E).