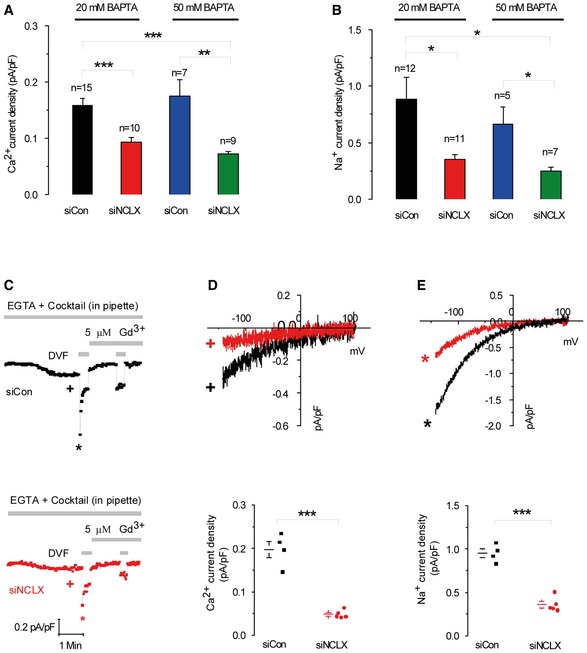
Electrophysiological CRAC recordings were performed on cells where store depletion was induced by the use of a pipette solution containing low buffering capacity (0.1 mM EGTA) with IP
3 (30 μM) and a cocktail to energize the mitochondria whose composition is listed in the
Results section. Representative time courses of whole‐cell current development at −100 mV (D, E) and measured in Ca
2+‐containing and DVF solutions, respectively, by comparison with siControl. At the end of recordings, 5 μM Gd
3+ was used to inhibit CRAC currents. Representative I–V relationships of Ca
2+ (D) and Na
+ (E) CRAC in cells transfected with siControl or siNCLX are taken from traces in (C) where indicated by color‐coded asterisks. Statistical analysis on Ca
2+ and Na
+ CRAC currents measured at −100 mV (D, E).