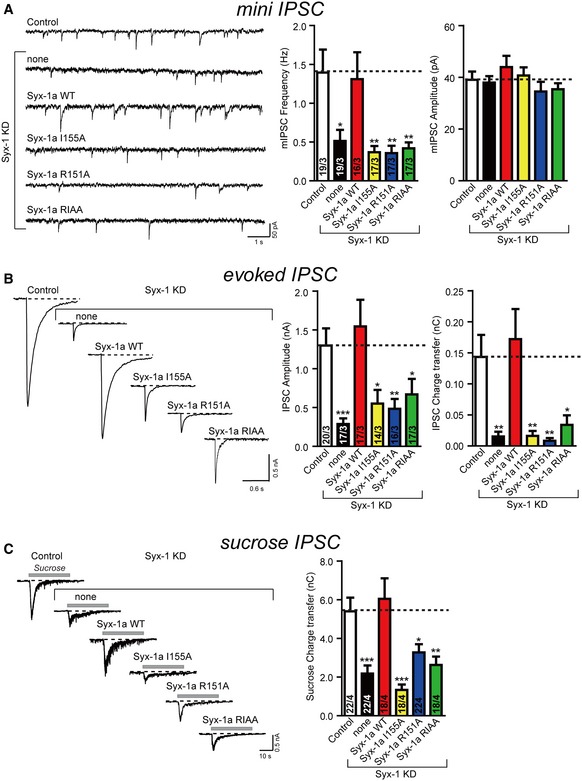
Sample traces (left) and summary graphs (right) of mIPSCs recorded in WT hippocampal neurons that were infected with a control lentivirus (Control) or a lentivirus expressing only syntaxin‐1 shRNAs (none) or syntaxin‐1 shRNAs plus either full‐length syntaxin‐1a (Syx‐1a WT), or full‐length syntaxin‐1a with the I155 mutation (Syx‐1a I155A), full‐length syntaxin‐1a with the R151 mutation (Syx‐1a R151A), or full‐length syntaxin‐1a with the R151A, I155A mutations (Syx‐1a RIAA), respectively.
Sample traces (left) and summary graphs (right) of action potential‐evoked IPSCs recorded in the infected neuronal cultures described in panel (A).
Sample traces (left) and summary graphs (right) of IPSCs evoked by 0.5 M sucrose, recorded in the infected neuronal cultures described in panel (A).
Data information: Shown are means ± SEM; the numbers of cells/independent cultures analyzed are listed in the individual bars. Statistical assessments were performed by Student's
t‐test comparing each condition to control (*
P < 0.05; **
P < 0.01; ***
P < 0.001).

