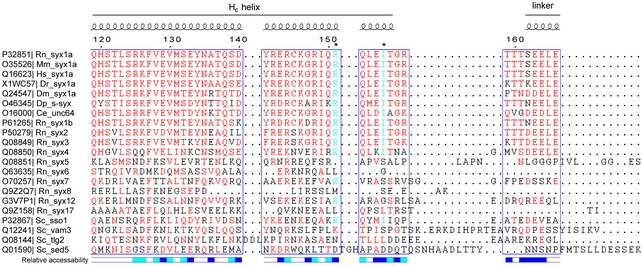
Figure EV3. Sequence alignment of the syntaxin‐1 linker region.

Sequence alignment was performed with Clustal Omega and interpreted with ESPript 3.0. Residues above 60% similarity are colored in red, and residues R151 and I155 are colored in cyan and indicated by asterisks on the top of the sequences. Secondary structure and relative solvent accessibility were calculated based on the crystal structure of the Munc18‐1/syntaxin‐1 complex (PDB entry 3C98): white, buried; blue, exposed; cyan, partially exposed. UniProt entries of each of the sequences are on the left. Rn, Rattus norvegicus; Mm, Mus musculus; Hs, Homo sapiens; Dr, Danio rerio; Dm, Drosophila melanogaster; Dp, Doryteuthis pealeii; Ce, Caenorhabditis elegans; Sc, Saccharomyces cerevisiae.
