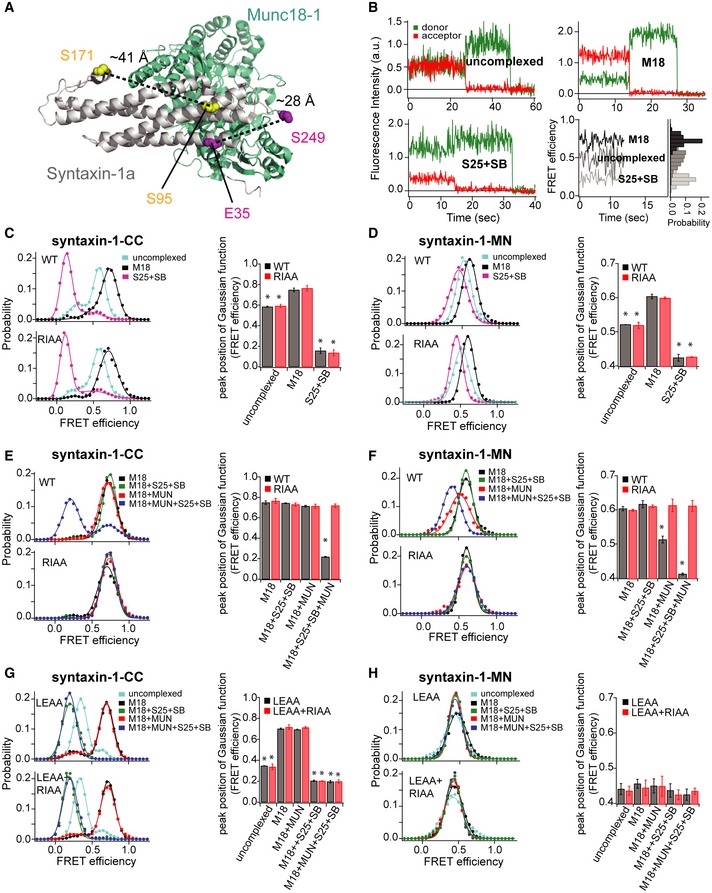
smFRET efficiency histograms and FRET efficiency values (bar chart) corresponding to the peak positions of the Gaussian functions fit to the smFRET efficiency histograms for the syntaxin‐1‐CC and ‐MN label pairs and conditions. For the smFRET efficiency histograms of uncomplexed syntaxin‐1‐CC, two Gaussian functions were used to fit the histogram to distinguish the two observed FRET efficiency populations; otherwise, a single Gaussian function was used to extract the FRET efficiency value. The areas under the Gaussian functions were calculated, and the peak position of the Gaussian function with the higher area was used as the FRET efficiency value (see
Appendix Table S1). The bar charts show mean values ± SD for the two subsets of an equal partition of the data that are comprised of the observed FRET efficiency values for all molecules for each different condition, *
P < 0.05, using the two‐tailed Student's
t‐test (see
Appendix Tables S1–S3). Shown are smFRET efficiency histograms for uncomplexed syntaxin‐1 and its RIAA mutant, bound to Munc18‐1, and within the ternary SNARE complex (C and D); smFRET efficiency histograms for syntaxin‐1 and its RIAA mutant bound to Munc18‐1, upon the addition of SNAP‐25 and synaptobrevin‐2, upon the addition of the MUN domain alone, and upon the simultaneous addition of SNAP‐25, synaptobrevin‐2, and the MUN domain (E and F); smFRET efficiency histograms for the LE and the LE+RI mutants of uncomplexed syntaxin‐1, in complex with Munc18‐1, upon the addition of SNAP‐25 and synaptobrevin‐2, the MUN domain alone, and SNAP‐25, synaptobrevin‐2, and the MUN domain simultaneously (G and H).

